Setup of US Dollar Prices Before PCE Data: USD/JPY, AUD/USD, and EUR/USD

Setup of US Dollar Prices Before PCE Data: USD/JPY, AUD/USD, and EUR/USD

The US dollar is broadly maintaining a weak tone going into key data this week, including GDP and a gauge of inflation, on rising expectations of rate cuts by the US Federal Reserve later this year.

US economic growth likely slowed to 2.0% on-quarter in the January-March quarter from 2.6% in the previous quarter as the impact of interest rate hikes spills over to the broader economy. Price pressures likely eased in March – Core PCE price index rose 4.5% on-year from 4.6% in February. Core measures, including CPI and PPI, appear to be in a cooling phase, but not enough for the Fed to proceed with one more rate hike at next week’s meeting. Beyond that, the market is pricing roughly 50 basis points of rate cuts by the end of the year.

EUR/USD Daily Chart
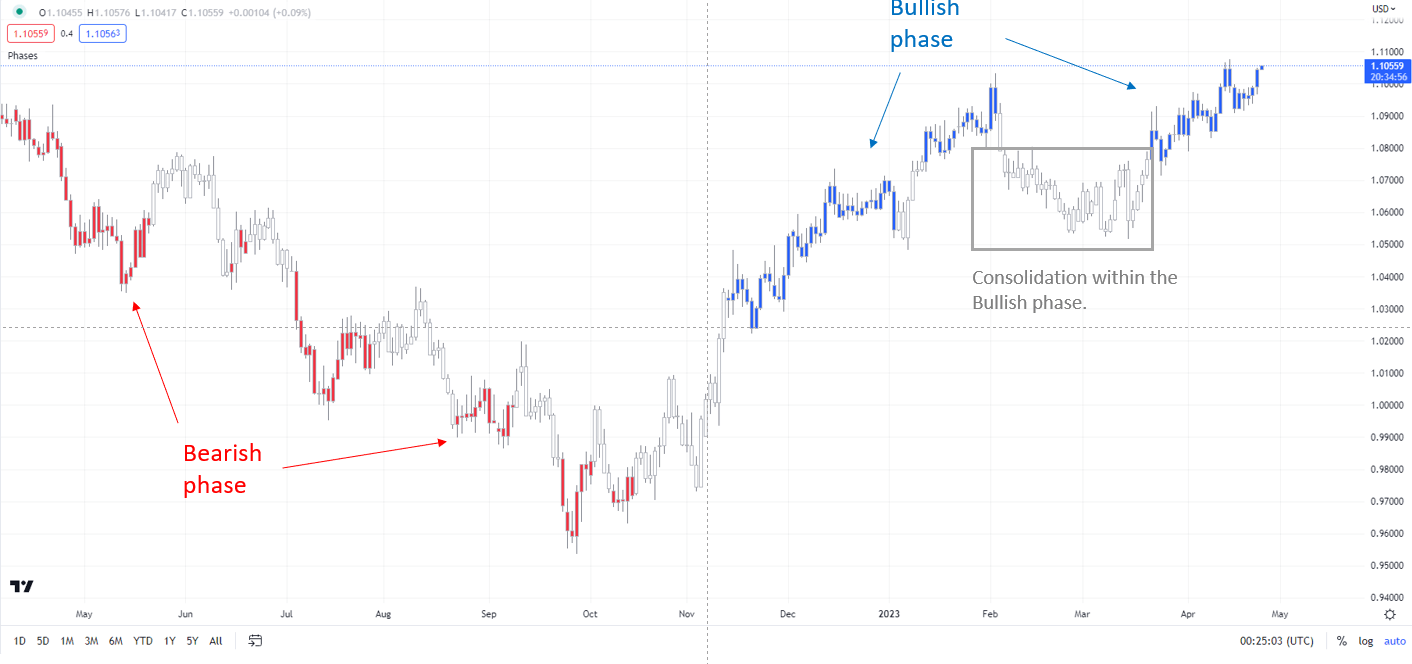
image1.png

Note: In the above colour-coded chart, Blue candles represent a Bullish phase. Red candles represent a Bearish phase. Grey candles serve as Consolidation phases (within a Bullish or a Bearish phase), but sometimes they tend to form at the end of a trend. Note: Candle colors are not predictive – they merely state what the current trend is. Indeed, the candle color can change in the next bar. False patterns can occur around the 200-period moving average, or around a support/resistance and/or in sideways/choppy market. The author does not guarantee the accuracy of the information. Past performance is not indicative of future performance. Users of the information do so at their own risk.

If data shows price pressures failed to ease last month, it could buy some more time for the US dollar, but won’t be enough to derail the downtrend. Furthermore, key macro data elsewhere could help set the tone for the US dollar, including Australia Q1 inflation and Germany GfK consumer confidence data due Wednesday, and BOJ interest rate decision and Euro area Q1 GDP due Friday.

EUR/USD Daily Chart
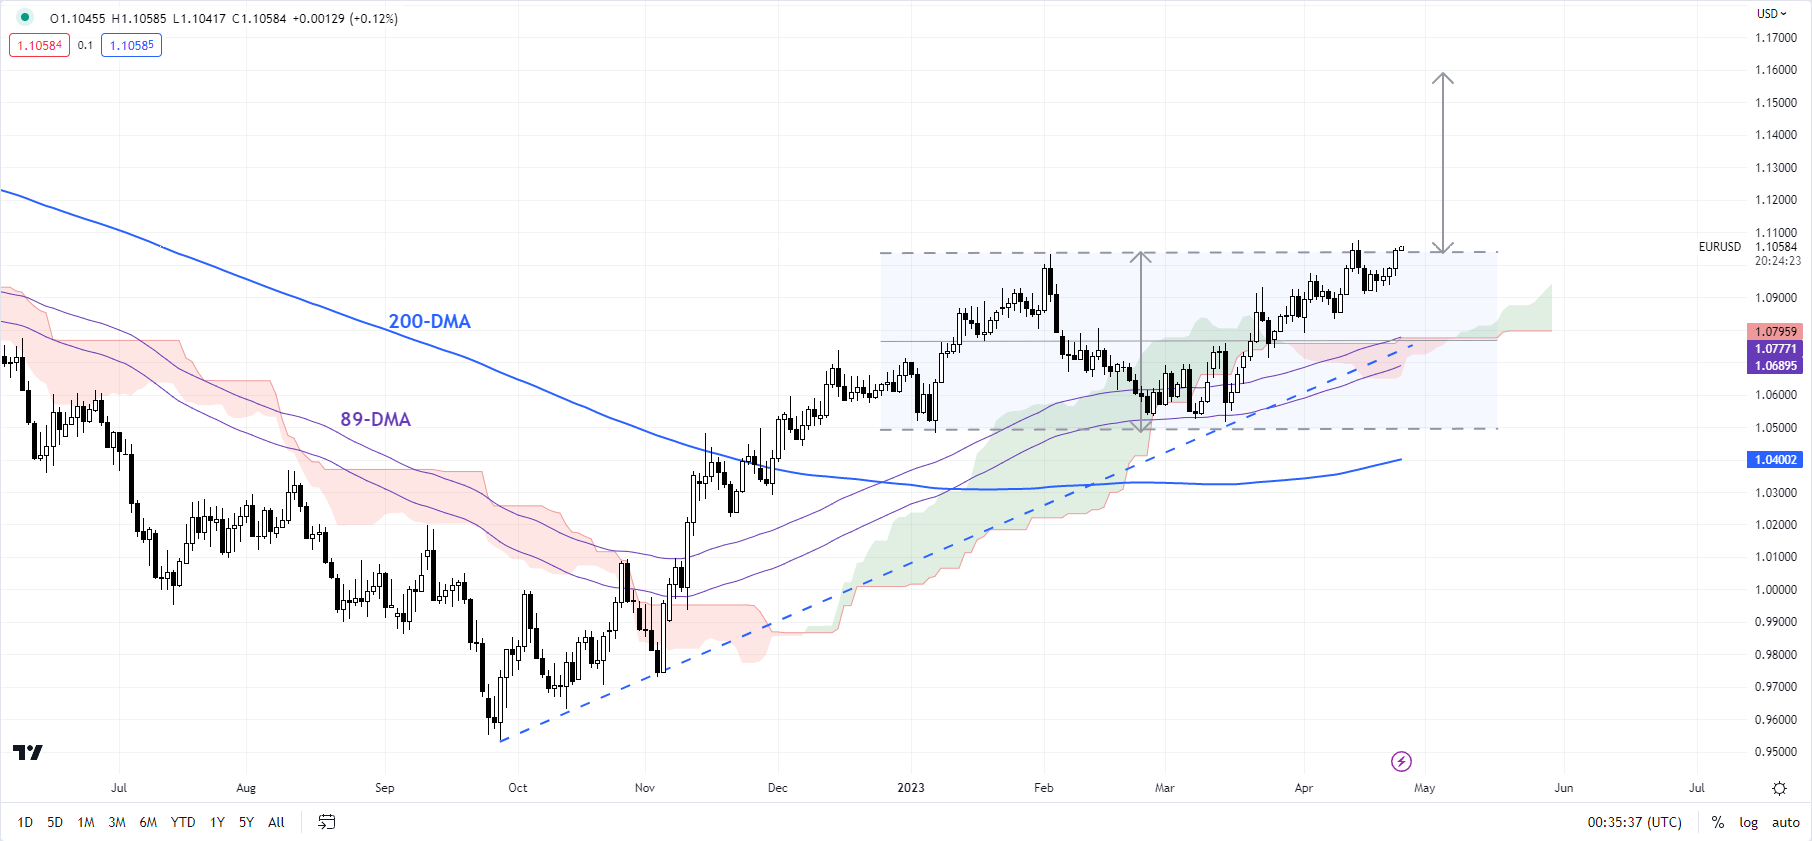
image2.png

EUR: Attempting to break above key resistance at 1.10

On technical charts, EUR/USD’s trend remains up on the daily charts, as the colour-coded candlestick charts based on trending/momentum indicators show. See previous updateson April 10andApril 13highlighting the uptrend. The pair is now preparing to break above a vital ceiling at the February high of 1.1035. A decisive break above could pave the way toward 1.1700 — the price objective of the double bottom pattern (the January and March lows).

AUD/USD Daily Chart
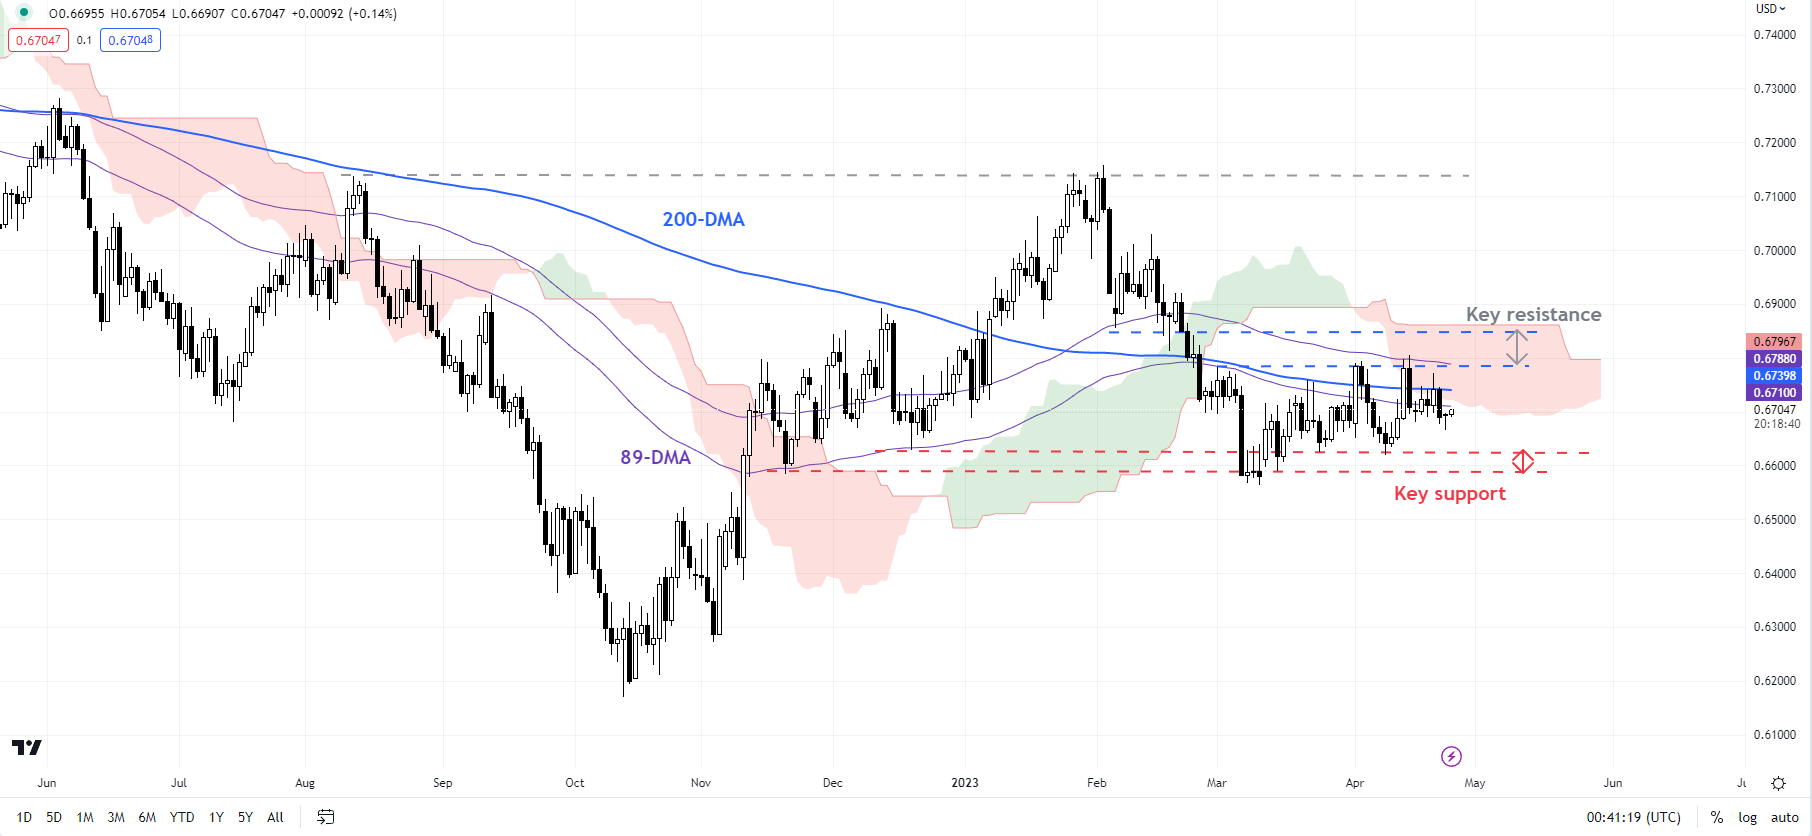
image3.png

AUD/USD: Capped by resistance

While AUD/USD has this month held above quite a strong support at the late-March low of 0.6625, the upward momentum subsequently has been lacking, leaving it vulnerable to another leg lower. So far, AUD/USD has been capped under a tough ceiling around the 200-day moving average, roughly coinciding with the early-April high of 0.6795. Unless the pair is able to cross the hurdle, the path of least resistance would remain sideways to down. On the downside, immediate support is at 0.6625, followed by a stronger cushion at the March low of 0.6550.

USD/JPY 240-minute Chart
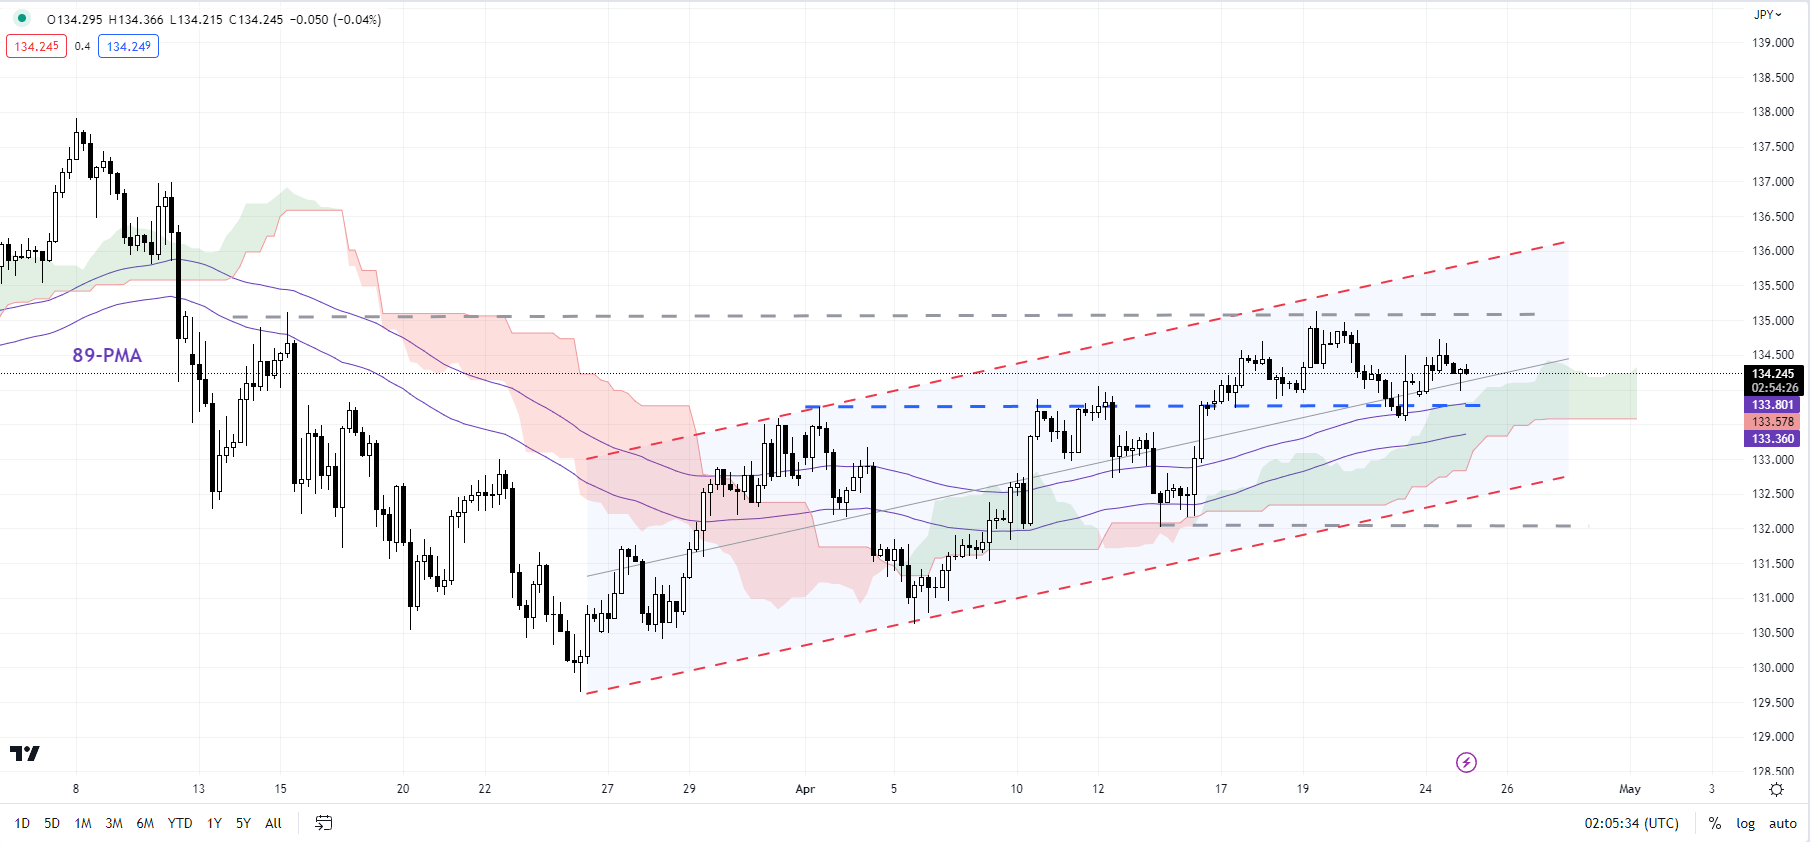
image4.png

USD/JPY: Looking for cues from BOJ and US data

USD/JPY’s minor rebound since March appears to have stalled at a key converged barrier: the 89-day moving average, coinciding with the upper edge of a rising channel from March, and the upper edge of the Ichimoku cloud on the daily charts. The upward pressure is unlikely to run out of steam while the pair holds above the immediate floor on a horizontal trendline from earlier this month at about 134.00. Any break below could expose the downside toward 132.00.

USD/JPY Daily Chart
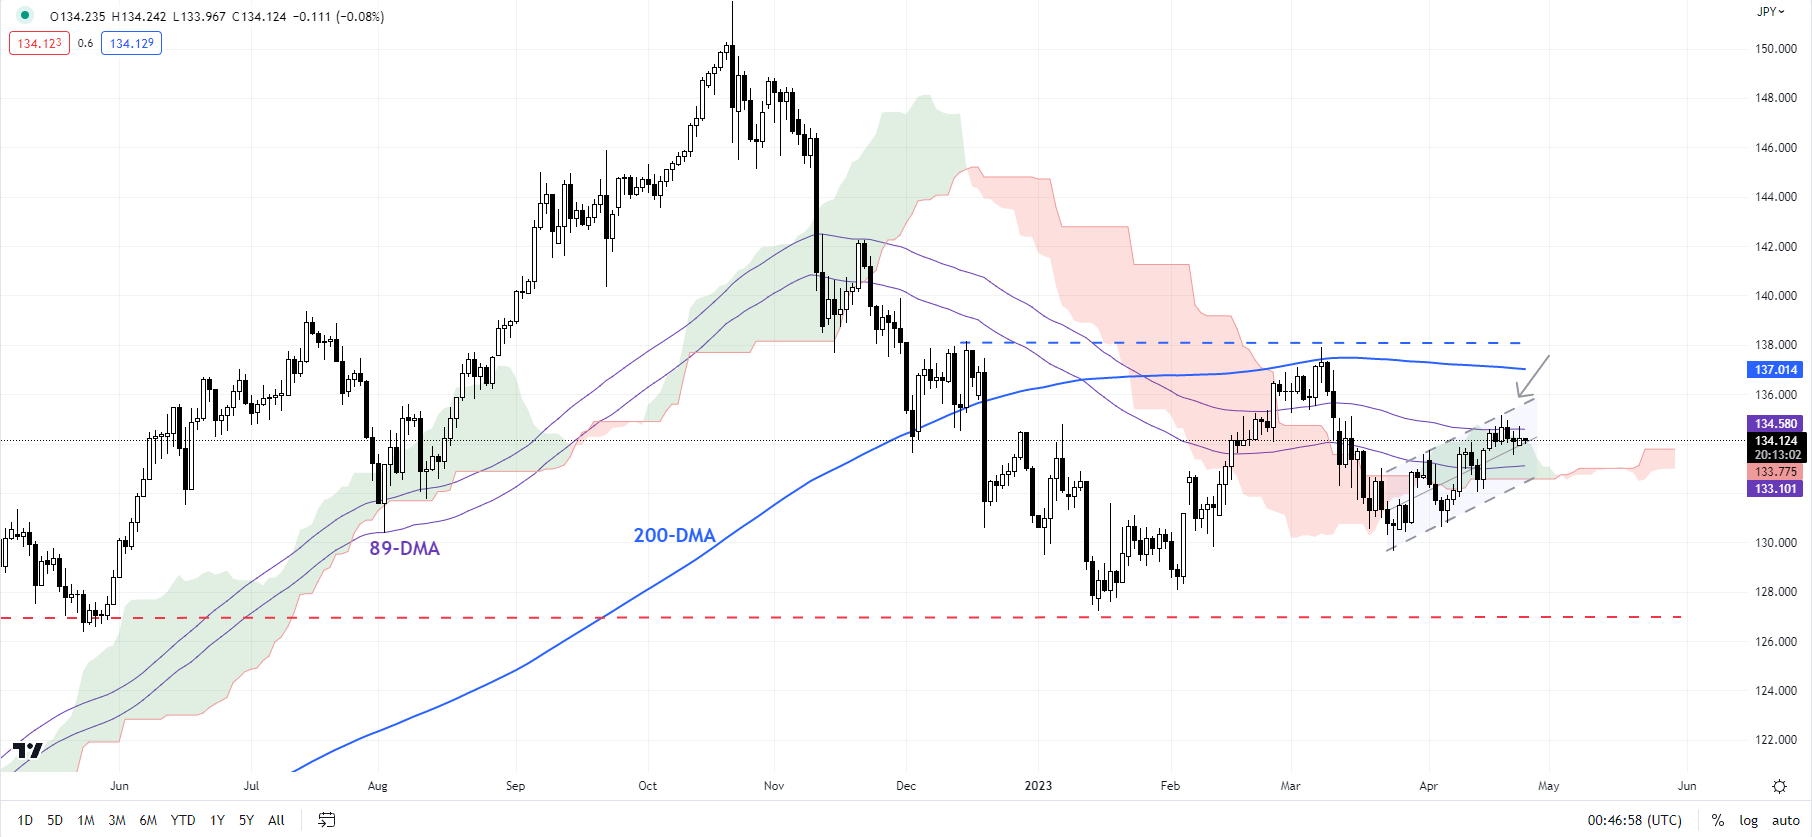
image5.png


Price Changes for Ethereum and Bitcoin: What else could go wrong?

Price Changes for Ethereum and Bitcoin: What else could go wrong?

Bitcoin and Ethereum have fallen sharply over the past couple of weeks, and chances are cryptocurrencies could decline further in the near term. However, it may be premature to assume that the multi-week-long rebound is over.

BITCOIN

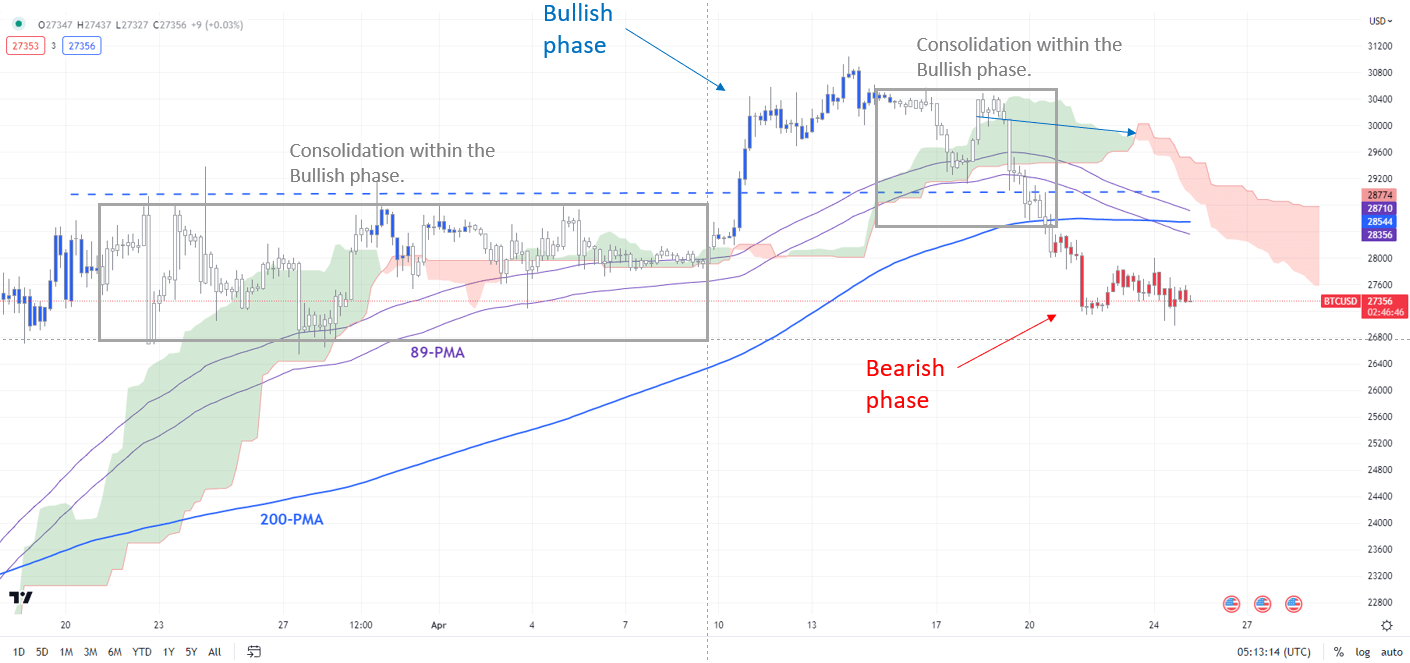
Bitcoin has pulled back sharply from near key resistance area: the May 2022 high of 32375, and an uptrend line from January, coinciding with the 89-week moving average – a risk highlighted in the previous update. See “Bitcoin Crosses the Key $30000 Mark: Will it Sustain?”, published April 11.

BTC/USD 240-minute Chart

image1.png

Note: In the above colour-coded chart, Blue candles represent a Bullish phase. Red candles represent a Bearish phase. Grey candles serve as Consolidation phases (within a Bullish or a Bearish phase), but sometimes they tend to form at the end of a trend. Note: Candle colors are not predictive – they merely state what the current trend is. Indeed, the candle color can change in the next bar. False patterns can occur around the 200-period moving average, or around a support/resistance and/or in sideways/choppy market. The author does not guarantee the accuracy of the information. Past performance is not indicative of future performance. Users of the information do so at their own risk.

The upward pressure has eased somewhat following the drop below support at the end-March high of around 29000. This is further reinforced by the colour-coded candlestick charts, based on trend/momentum indicators, on the 240-minute charts –BTC/USD has entered a bearish phase in the intraday timeframe.

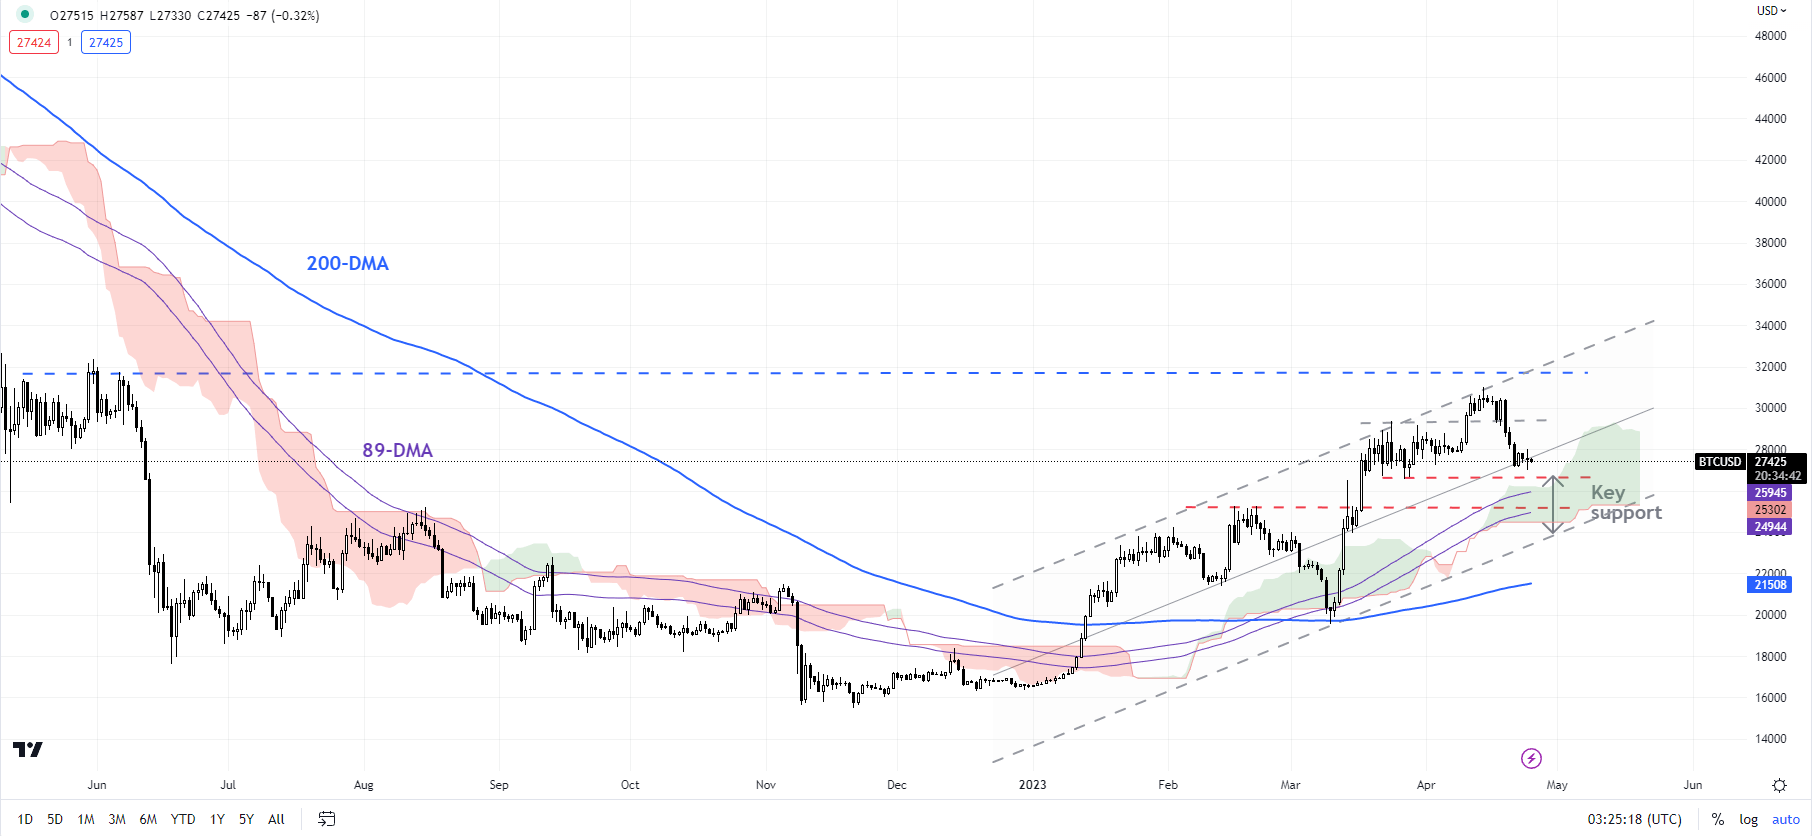
BTC/USD Daily Chart

image2.png

The downward momentum could push BTC/USD toward initial support at the end-March low of 26525. Beyond that, further downside could be limited given plenty of cushions: the 89-day moving average and the lower edge of the Ichimoku cloud on the daily charts, near the February highs of 24250-25250.

ETH/USD Daily Chart

image3.png

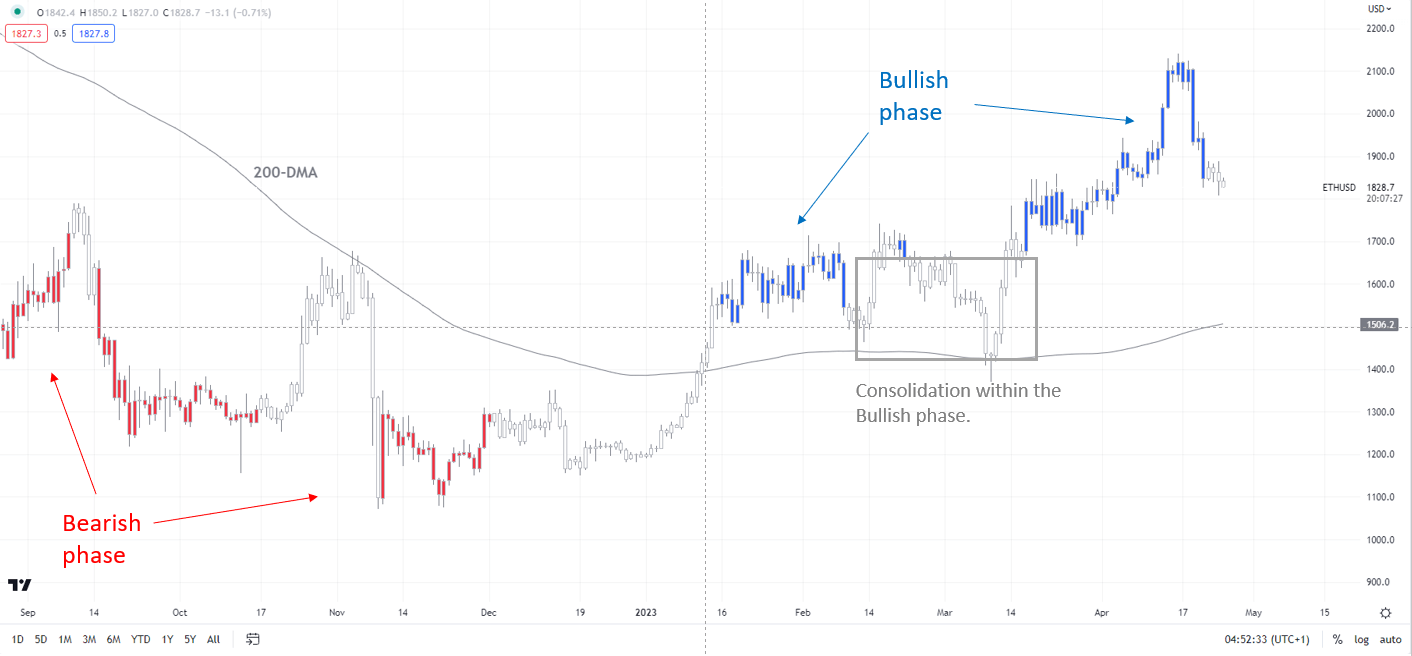
Note: In the above colour-coded chart, Blue candles represent a Bullish phase. Red candles represent a Bearish phase. Grey candles serve as Consolidation phases (within a Bullish or a Bearish phase), but sometimes they tend to form at the end of a trend. Note: Candle colors are not predictive – they merely state what the current trend is. Indeed, the candle color can change in the next bar. False patterns can occur around the 200-period moving average, or around a support/resistance and/or in sideways/choppy market. The author does not guarantee the accuracy of the information. Past performance is not indicative of future performance. Users of the information do so at their own risk.

Notwithstanding the recent retreat, the broader trend remains up on the daily charts – a trend that has been prevalent since January – see “Bitcoin Technical Outlook: BTC/USD Turns Bullish”, published January 18. Hence, for the five-month-long uptrend to reverse, BTC/USD would need to fall below strong support at the March low of 19540.

ETHEREUM

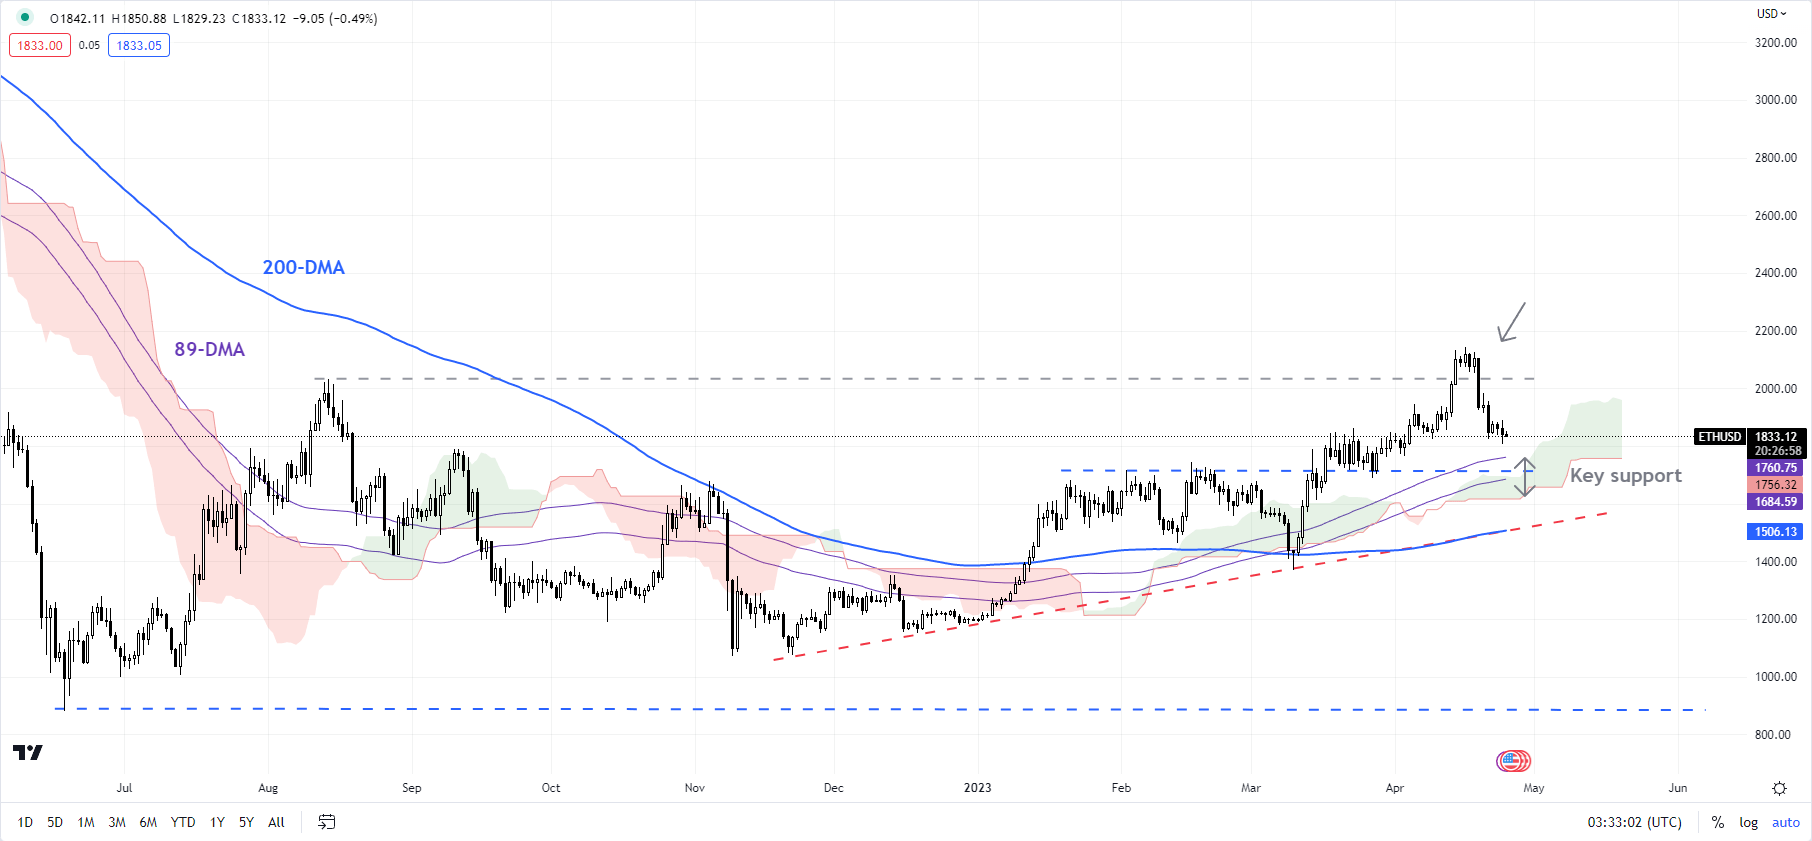
The technical posture in ETH/USD is similar – bullish on the daily charts, as the colour-coded candlestick charts show. Ethereum has pulled back from a fairly strong ceiling at the August high of 2030.

ETH/USD Daily Chart

image4.png

Still, there is a strong converged cushion on the 89-day moving average, the lower edge of the Ichimoku cloud on the daily chart, and a horizontal trendline from February at about 1715. Unless ETH/USD falls below the 1350-1500 area, including the 200-day moving average and the March low, the broader trend continues to be up.

JPY Pursuing Ascending Channel Break

JPY Pursuing Ascending Channel Break

JAPANESE YEN FUNDAMENTAL BACKDROP

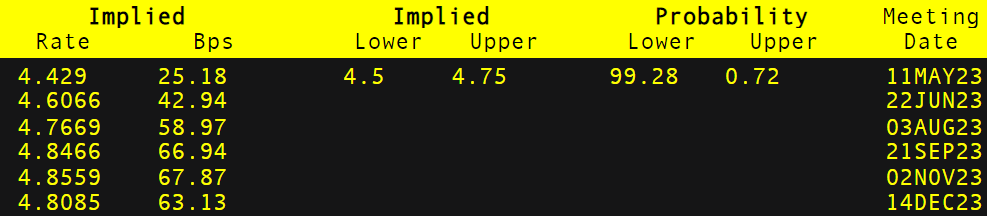
The Japanese Yen has given back much of its gains seen in early March after optimism around the new Bank of Japan (BoJ) Governor Kazuo Ueda and a potential shift away from the long standing ultra-loose monetary policy. Since then, there has been little in the way of guidance from the BoJ to shift their policies while money market pricing (refer to table below) suggest policy hikes are unlikely in 2023.

BANK OF JAPAN (BOJ) INTEREST RATE PROBABILITIES

image1.png

This week, the BoJ will kick-off central bank rate decision on Friday with revised economic forecasts of high importance alongside any mentioned of Yield Curve Control (YCC). The graph below shows the BoJ’s expanding balance sheet stemming from Japanese Government Bond (JGB) purchases to defend their yield caps. The fact that easing measures have been a staple of global markets for many years, any slight adjustment could induce a heightened reaction.

BANK OF JAPAN BALANCE SHEET

image2.png

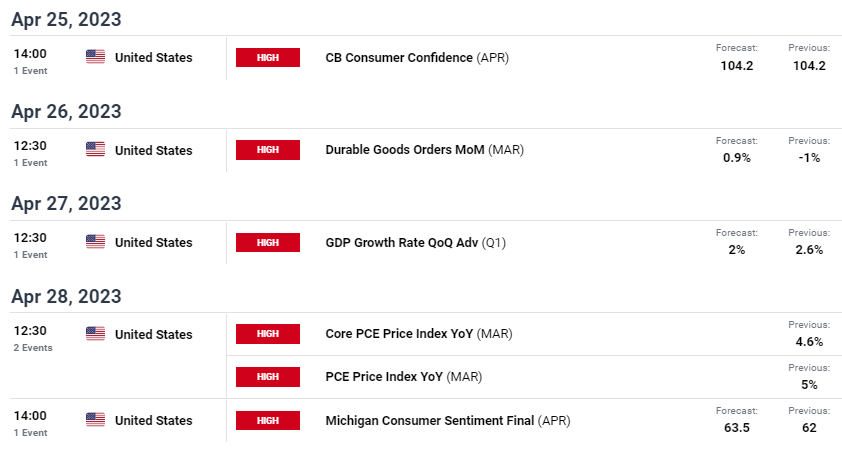
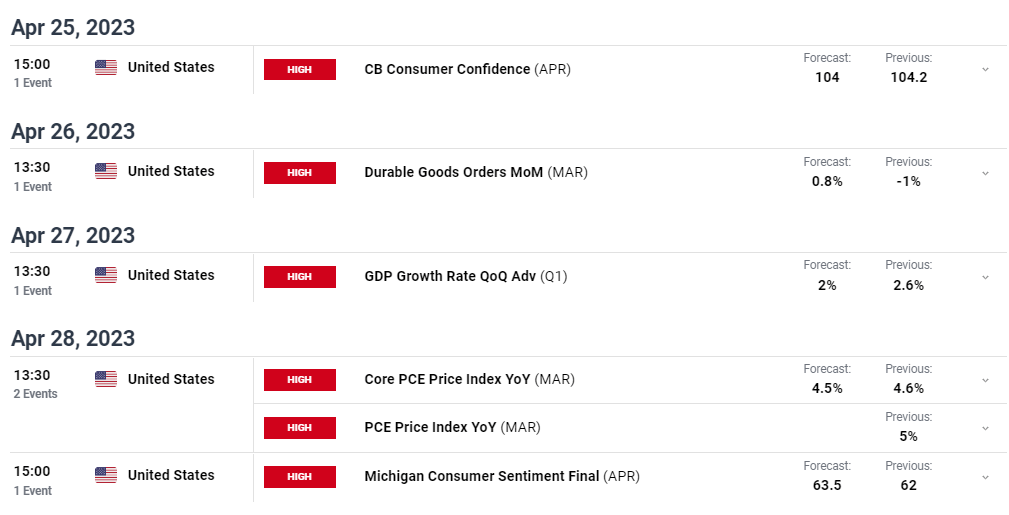
US centric data will guide the pair ahead of the rate announcement but many of these data points are projected to suggest a slowing US economy and thus could favor JY strength. Key releases include US GDP, durable goods orders and the Fed’s preferred measure of inflation, core PCE in a week where the Fed’s blackout period is underway (no Fed speak!).

ECONOMIC CALENDAR

image3.png

TECHNICAL ANALYSIS

USD/JPY DAILY CHART

image4.png


GBP/USD Price Forecast: Steady Pound Faces Big Data Week

GBP/USD Price Forecast: Steady Pound Faces Big Data Week

GBPUSD FUNDAMENTAL BACKDROP

The British pound remains resilient against the USD on Monday morning in what is scheduled to be a quiet week in terms of UK data. A quick recap last week revealed higher inflationary pressures, marginal improvements on retail sales and PMI numbers alongside tight labor market data. Markets reacted rather aggressively that led to a hawkish re-pricing of the Bank of England’s (BoE) interest rate probabilities (see table below), now including almost 3 additional rate hikes this year! While this is likely an overestimation, it looks clear that the BoE may not cut at all this year. Follow through from the already tight monetary policy may still filter through which is why I foresee less than 3 hikes for this year while adopting a more patient approach before hastily raising rates.

BANK OF ENGLAND INTEREST RATE PROBABILTIEIS

image1.png

Source: Refinitiv

This week is the turn of the US as shown in the economic calendar below. A slew of high impact data that will contribute to the upcoming Fed rate decision next week. Fed guidance has been rather one sided and in favor of a higher for longer approach to quell inflation. That being said, the Fed blackout period has commenced so markets will not receive added insight until the May 4th (end of the blackout period), emphasizing upcoming data. Most data points are expected to portray a slowing US economy, leaving room for further pound strength should this come to fruition.

Trade Smarter – Sign up for the DailyFX Newsletter

Receive timely and compelling market commentary from the DailyFX team

Subscribe to Newsletter

ECONOMIC CALENDAR

image2.png

Source: DailyFX Economic Calendar

TECHNICAL ANALYSIS

GBP/USD DAILY CHART

image3.png

Chart prepared by Warren Venketas, IG

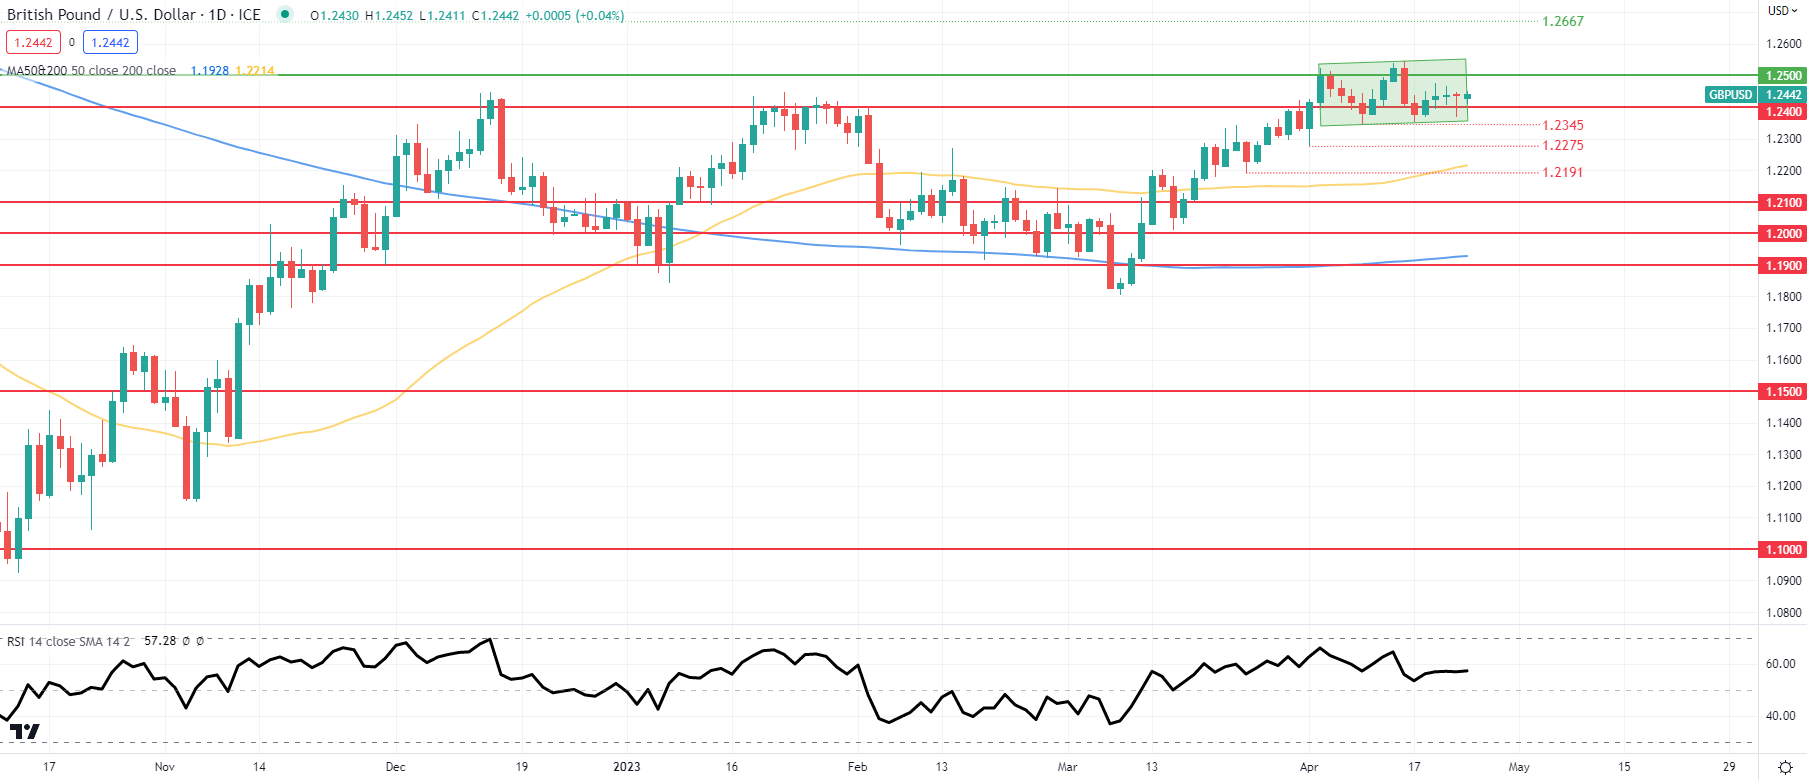
Daily GBP/USD price action continues to exhibit indecisiveness within the short-term consolidatory pattern (green). With no major releases today, I anticipate minimal price movement on the pair sandwiched between the 1.2400 and 1.2500 psychological levels respectively.

Key resistance levels:

  • 1.2667
  • 1.2500

Key support levels:

  • 1.2400
  • 1.2345

BEARISH IG CLIENT SENTIMENT

IG Client Sentiment Data (IGCS) shows retail traders are currently net SHORT on GBP/USD with 57% of traders net short (as of this writing). At DailyFX we typically take a contrarian view to crowd sentiment but due to recent changes in long and short-positioning, we arrive at a short-term downside bias.

Japanese Yen Q2 Technical Forecast: Yen Looks Set for Gains in Q2

Japanese Yen Q2 Technical Forecast: Yen Looks Set for Gains in Q2

Japanese Yen Q1 Recap

The Japanese Yen has had an interesting Q1 to say the least with the Yen starting the quarter looking vulnerable against the Greenback. The US Federal Reserve looked set to continue on an aggressive hiking cycle while the Bank of Japan looked set to continue down its easy monetary policy path.

February turned out to be a difficult month for the Yen as it posted steep losses against the US Dollar. The losses were compounded by the rising odds for a higher peak rate from the US Federal Reserve as US data came in better than expected for the majority of February. Late February was the start of the Yen’s recovery with March seeing the Banking sector woes accelerate the decline in USDJPY as the pair declined some 700-odd pips since February 28.

As we head into Q2 the Yen is basically flat against the Greenback with the early gains made in Q1 effectively wiped out. The question we have to ask is are we going to see a continuation of the Yen’s recent comeback over the coming months? While this article focuses on the JPY technical outlook, Q2 has a host of key fundamentals that could drive the Yens direction – download the full Q2 forecast below:

Technical Outlook – USD/JPY

USDJPY Monthly Chart

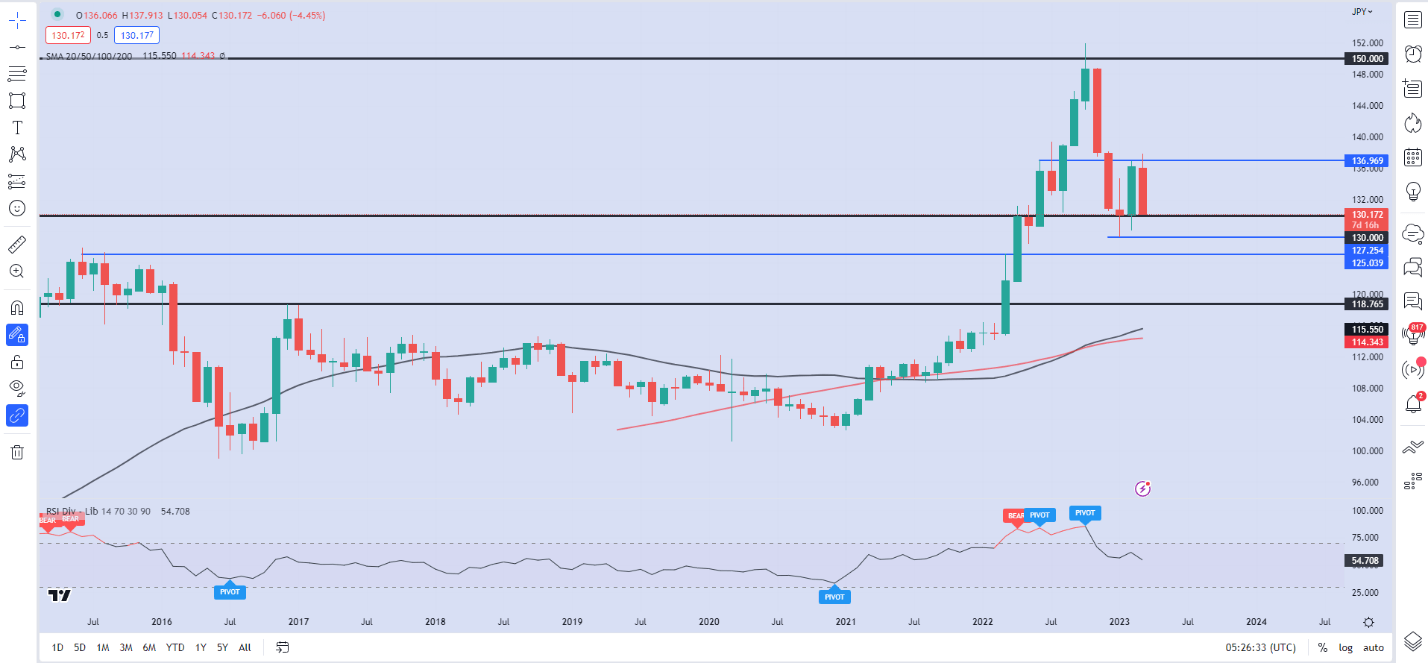
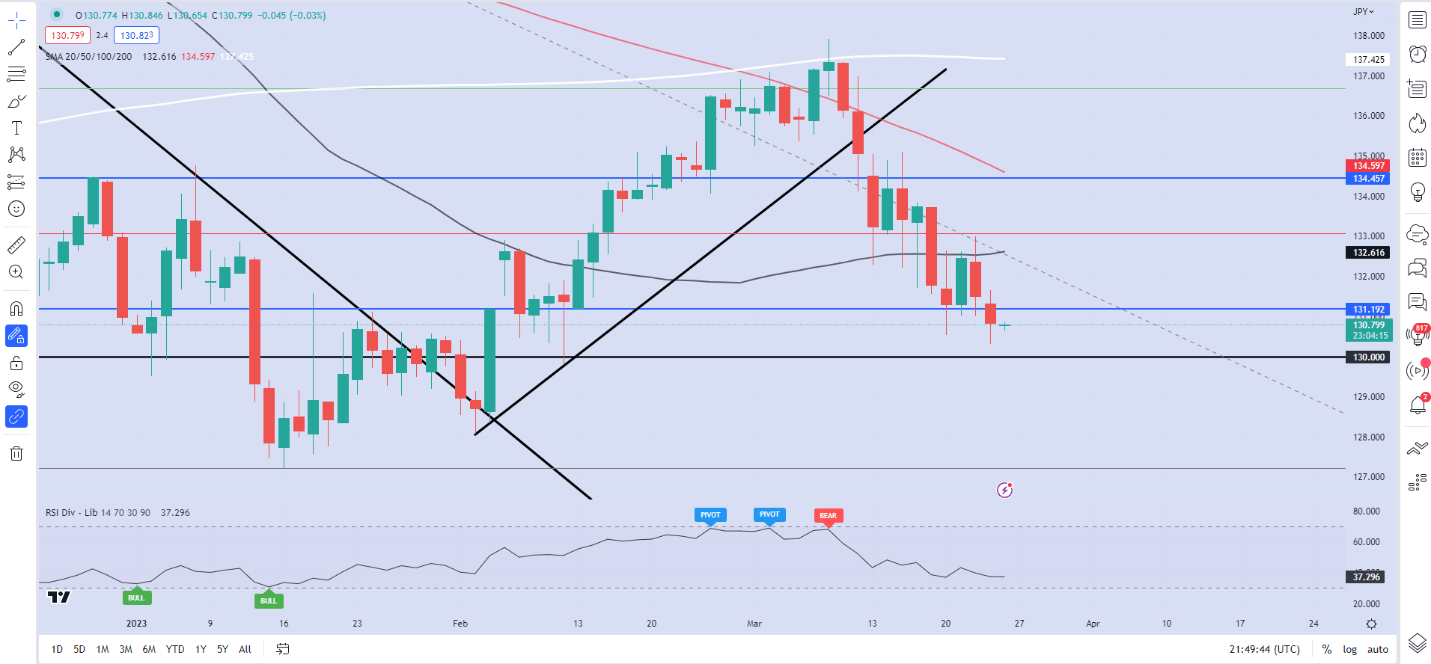
Graphical user interface  Description automatically generated with medium confidenceUSDJPY on the weekly timeframe has been on a steady decline since February 27, with four consecutive weeks of losses. Price is approaching the psychological 130.000 level (at the time of writing) with the monthly candle looking set to close as bearish engulfing candle. A monthly close below the 130.000 handle should lead to further downside for the pair as we haven’t seen a close below since breaking above the psychological 130.00 level in June 2022.

USDJPY Daily Chart

Chart  Description automatically generatedSource: TradingView, chart prepared by Zain Vawda

Price action on the daily timeframe has seen us print a fresh low with retracement now a possibility. Should a pullback materialize immediate resistance rests at 132.600 (50-day MA) with a break higher potentially leading to a retest of the 100-day MA around the 134.600 handle. The YTD high just above 137.000 has held firm so far in 2023 and holds the key to keep the bearish trend intact.

On the downside a break of the psychological level at 130.00 brings the YTD low of 127.250 back into focus. A candle close below this level could see a test of support resting at 125.000 (March 22 swing high).

Trading strategies

Trading strategies

Library of Forex strategies with detailed descriptions, developed by professional traders

Forex trading strategies compose a free library of trading systems created by experienced traders. New profitable Forex trade strategies are constantly added to our library, we carefully select the materials and collect only the best and working currency trading strategies around the world.
In order to find the most suitable currency trading strategy for you, you need to take into account all aspects of your trade: preferred tools, market behavior model, psychological factor, etc. A systematic approach will help you choose the exact trade strategy in Forex that will work for you and increase the efficiency of Forex trading.
That is why LiteFinance gathered all sorts of actual working trading strategies in one place. Our library presents both intraday Forex strategies and medium-term trading systems. We selected the best Forex graphic patterns, currency trading strategies, stock exchange and scalping Forex strategies. Select the very trading strategy that meets your preferences completely and will help make your work on the Forex market as efficient as possible.

Discover the Forex social world of professional trading by copying trades

Discover the Forex social world of professional trading by copying trades

The automated copy-trading system Soсial Trading will allow you to duplicate the best trades, trade independently, share information and communicate with your traders.

Take advantage of successful traders’ experience or share your own success with others through our Social Forex Trading system. Depending on your goals, choose the role that really suits you and achieve your objectives!

US Dollar (DXY) Little Changed Ahead of Weighty Economic Data

US Dollar (DXY) Little Changed Ahead of Weighty Economic Data

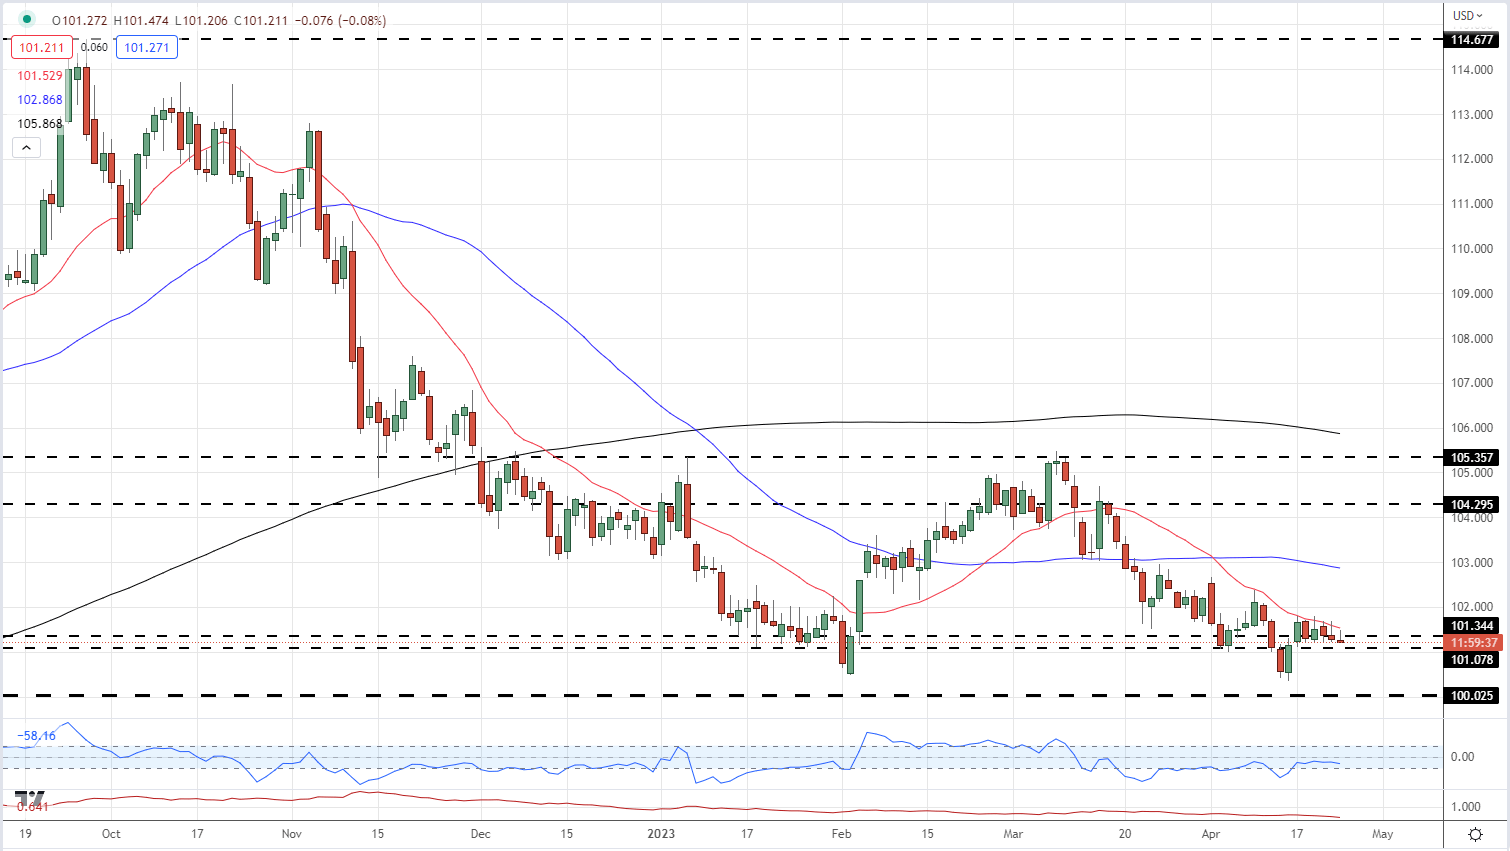
The first look at US Q1 GDP and the latest Core PCE data are the highlights of a busy week for the US dollar as traders gear themselves for next week’s FOMC rate decision. Financial markets are pricing in a 25 basis point rate hike on May 3rd (86% probability), before the central pauses for the next three meetings. The first-rate cut in the US is currently seen at the November 1st meeting but this may change depending on this week’s economic releases. There will be no Fed commentary until next week’s FOMC meeting.

image1.png

For all market-moving data releases and economic events see the real-time DailyFX calendar while the new Earnings Calendar highlights this quarter’s global company releases.

US Bill and Bond yields are marginally lower today with the 3-month T Bill on offer at 4.96%, down from 5.09% last week, while the US Treasury 2-year is trading at 4.15%, down from last Wednesday’s 4.29% multi-week high. Short-dated US Bill yields have been pushed higher recently by higher rate expectations and fears over the impending US debt ceiling. The US 10-year/2-year curve is inverted by 61 basis points, an ongoing signal that the market expects the US to enter into a recession this year.

Current US dollar price action is limited and confined to a tight short-term trading range. The greenback is testing support around 101.10 and a break below here would see 101.00 and then the 100.40-100.60 area as the next levels of technical support. The US dollar has made repeated attempts to break above the 20-day moving average in recent days and failed, highlighting the greenback’s current weakness.

US Dollar (DXY) Daily Price Chart – April 24, 2023

image2.png


Is it wise to trade forex if it’s a public holiday in one of the countries?

Is it wise to trade forex if it’s a public holiday in one of the countries?

Trading forex during public holidays in one of the currencies’ countries can be risky, so caution is advised. There are a few things to consider:

1. Liquidity may be low. With one major market closed, liquidity often drops significantly for the related currency pair. This can lead to volatile price swings that are hard to predict. It may be difficult to get in and out of positions at your desired price levels.

2. News events are limited. There are typically fewer economic reports and news events on public holidays to drive the markets. Without major catalysts, the price action may appear “choppy” and random. This can trip up technical traders and trend followers.

3. Spreads may widen. Brokerage firms often widen the bid-ask spreads on currency pairs when one of the major markets is closed. This is to account for the lower liquidity and higher volatility. The wider spreads mean higher costs for traders.

4. Gaps are possible. When the closed market reopens, there is a possibility of price gaps forming on the charts. If you have open positions during the holiday period, these gaps can lead to losses as the price may jump against your position.

However, public holidays also present some trading opportunities:

• Trends may continue. If there is an ongoing trend leading into the holiday, it may continue for a few more hours after the close. You may be able to ride trends for a bit and exit before volatility picks up.

• Volatility spikes. Some traders look for volatility spikes during low-liquidity periods around holidays to trade in and out quickly. If timed right, short-term profits can be captured from volatility.

• Gaps can be favorable. Gaps that form when a market reopens can sometimes occur in the direction of the overall trend. If you time it right, you may enter a trade after the gap that continues the trend. But unpredictable gaps can also go against you.

So in summary, while forex trading around public holidays in related currencies can be risky due to volatility and uncertainty, it offers some short-term opportunity as well for active traders. But for most traders, it is probably wiser to avoid trading for a few hours around the holidays due to the added volatility and costs. If any positions are left open during the closed market hours, manage risks carefully.

US Dollar holds its ground, oil costs slide on deteriorating request standpoint

US Dollar holds its ground, oil costs slide on deteriorating request standpoint

The US Dollar (USD) keeps its footing following Wednesday’s modest rebound as investors continue to stay away from risk-sensitive assets. Meanwhile, the renewed USD strength and growing concerns over a worsening demand outlook drag crude oil prices lower. Signs of sticky inflation in major economies remind market participants that central banks could cling to tight monetary policies at the cost of a slowdown in activity.

The US Dollar Index, which tracks the USD performance against a basket of six major currencies, stays in a tight range near 102.00 on Thursday. On a weekly basis, the index stays in positive territory, looking to snap a five-week losing streak.

Technical analysis: US Dollar Index stays below key resistance

The US Dollar Index trades slightly below the 20-day Simple Moving Average (SMA), currently located at 102.20. In case the DXY closes the day above that level, it could target 103.00 (static level, psychological level) and 103.50 (50-day SMA, 100-day SMA).

Meanwhile, the Relative Strength Index (RSI) indicator on the daily chart moves sideways near 50, suggesting that sellers refrain from committing to further USD weakness.

On the downside, 101.50 (static level) align as interim support ahead of 101.00/100.80 (psychological level, static level, multi-month low set on April 14). A daily close below that support area could open the door for an extended slide toward 100.00 (psychological level).

How does Fed’s policy impact US Dollar?

The US Federal Reserve (Fed) has two mandates: maximum employment and price stability. The Fed uses interest rates as the primary tool to reach its goals but has to find the right balance. If the Fed is concerned about inflation, it tightens its policy by raising the interest rate to increase the cost of borrowing and encourage saving. In that scenario, the US Dollar (USD) is likely to gain value due to decreasing money supply. On the other hand, the Fed could decide to loosen its policy via rate cuts if it’s concerned about a rising unemployment rate due to a slowdown in economic activity. Lower interest rates are likely to lead to a growth in investment and allow companies to hire more people. In that case, the USD is expected to lose value.

The Fed also uses quantitative tightening (QT) or quantitative easing (QE) to adjust the size of its balance sheet and steer the economy in the desired direction. QE refers to the Fed buying assets, such as government bonds, in the open market to spur growth and QT is exactly the opposite. QE is widely seen as a USD-negative central bank policy action and vice versa.