GBPUSD eyes April’s bar; 2021 trendline in focus too

GBPUSD eyes April’s bar; 2021 trendline in focus too

GBPUSD managed to close marginally above the December-January ceiling of 1.2445 on Monday after a three-day intense battle, shifting the spotlight to April’s bar of 1.2520.


Some caution is necessary as the RSI and the MACD have yet to correct their negative trajectory. Yet, with the price having recently secured another strong foothold around its 20-day simple moving average (SMA) and at the lower boundary of the seven-week-old bullish channel, a continuation higher seems to be very likely.

The bulls will need another win around the nearby monthly resistance of 1.2520 in order to advance towards the April-May 2022 peak of 1.2665. Strikingly, the long-term resistance trendline drawn from the 2021 top is also in the neighborhood. Hence, a victory at this point may push the price directly up to the channel’s upper line seen at 1.2830. Slightly higher, the 61.8% Fibonacci retracement level of the 2021-2022 downtrend at 1.3000 could be another tough obstacle.

In the event the price flips backwards, exiting the channel on the downside at 1.2400, the 50% Fibonacci mark of 1.2285 could immediately come to the rescue. The 50-day SMA might be tested too before the bears attempt to reach the 1.2045-1.1975 constraining zone and the 200-day SMA.

All in all, GBPUSD is looking cautiously bullish in the short-term picture. A decisive close above 1.2520 could confirm additional gains towards a familiar resistance line near 1.2665.


More from Ueda: Trend inflation remains below 2% but gradually accelerating

More from Ueda: Trend inflation remains below 2% but gradually accelerating

Bank of Japan Governor Ueda: • Trend inflation remains below 2% but gradually accelerating, which is partly due to effect of monetary easing. • It takes a very long for impact of monetary policy steps to appear on economy, prices. • Monetary policy steps taken now will affect economy, prices half-year, 1 year, 1.5 years ahead. • Tightening monetary policy now could push down inflation in future, which is already likely to slow on dissipating effect of import costs. • If we see risk of runaway inflation, we must normalise monetary policy We see risk of inflation undershooting forecast as bigger than risk

USD/JPY and the US CB Consumer Confidence Index at 135

USD/JPY and the US CB Consumer Confidence Index at 135

It is a quiet start to the day for the USD/JPY. There are no economic indicators from Japan or the region to influence. The lack of stats will leave the USD/JPY in the hands of market risk sentiment.

On Monday, US economic indicators disappointed, with manufacturing sector data revealing more cracks in the US economy. Risk-off sentiment weighed on US Treasury yields, leading the greenback into the negative territory against most majors.

Trading Derivatives carries a high level of risk to your capital and you should only trade with money you can afford to lose. Trading Derivatives may not be suitable for all investors, so please ensure that you fully understand the risks involved, and seek independent advice if necessary. A Product Disclosure Statement (PDS) can be obtained either from this website or on request from our offices and should be considered before entering into a transaction with us. Raw Spread accounts offer spreads from 0.0 pips with a commission charge of USD $3.50 per 100k traded. Standard account offer spreads from 1 pips with no additional commission charges. Spreads on CFD indices start at 0.4 points. The information on this site is not directed at residents in any country or jurisdiction where such distribution or use would be contrary to local law or regulation.

However, monetary policy divergence left the USD/JPY in positive territory, with the BoJ showing no signs of a shift in course from ultra-loose. On Monday, the markets cemented a 25-basis point Fed interest rate hike in May and raised the bets of a June hike.

According to the CME FedWatchTool, the probability of a 25-basis point May interest rate hike rose from 89.1% to 98.9% on Monday. Significantly, the chances of a June hike climbed from 23.4% to 24.7%.

With no stats from the region to consider, BoJ commentary will also influence ahead of the US session.

USD/JPY Price Action

This morning, the USD/JPY was down 0.11% to 134.084. The USD/JPY rose to an early high of 134.242 before falling to a low of 133.967.

USD/JPY sees early red.
USDJPY 250423 Daily Chart

The USD/JPY needs to move through the 134.285 pivot to target the First Major Resistance Level (R1) at 134.68 and the Monday high of 134.730. A return to 134.500 would signal a bullish USD/JPY session. However, market risk sentiment and US stats must support a USD/JPY breakout.

In case of an extended rally, the bulls would likely test the Second Major Resistance Level (R2) at 135.125. The Third Major Resistance Level (R3) sits at 135.965.

Failure to move through the pivot would leave the First Major Support Level (S1) at 133.840 in play. However, barring a dollar sell-off, the USD/JPY pair should avoid sub-133. The Second Major Support Level (S2) at 133.445 should limit the downside. The Third Major Support Level (S3) sits at 132.605.

USD/JPY support levels in play below the pivot.
USDJPY
Looking at the EMAs and the 4-hourly chart, the EMAs send a bullish signal. The USD/JPY sits above the 50-day EMA (133.912). The 50-day EMA pulled away from the 200-day EMA, with the 100-day EMA widening from the 200-day EMA, delivering bullish signals.

A USD/JPY holding above the 50-day EMA (133.912) would support a breakout from R1 (134.680) to target R2 (135.125). However, a fall through the 50-day EMA (133.912) and S1 (133.840) would bring the 100-day EMA (133.507) and S2 (133.445) into view. A fall through the 50-day EMA would send a bearish signal.

EMAs remain bullish.
USDJPY 250423 4 Hourly Chart

The US Session

Looking ahead to the US session, it is a busier day on the US economic calendar. US consumer confidence figures for April will draw interest.

However, economists forecast the CB Consumer Confidence Index to slip from 104.2 to 104. A fall below 100 would move the dial. There is no Fed talk for investors to consider. The Fed entered the blackout period on Saturday.

House price numbers are also due but should have a limited impact on the USD/JPY.

Away from the economic calendar, US corporate earnings will also influence US Treasury yields. Big names on the US earnings calendar include Microsoft (MSFT), Alphabet Inc. (GOOGL), Visa Inc. (V), McDonald’s Corp. (MCD), General Motors Co. (GM), and PepsiCo Inc. (PEP).

US Dollar corrects as focus shifts to US tech earnings, economic data

US Dollar corrects as focus shifts to US tech earnings, economic data

The United States Dollar (USD) is correcting from weekly lows, as bulls find their footing amid broad risk-aversion. Rising tensions over the approaching US debt ceiling deadline and a lack of clarity on the Federal Reserve (Fed) interest rates outlook weigh on the market sentiment. Investors readjust their US Dollar positions, bracing for a week of high-profile quarterly earnings and closely watched economic data from the United States.

Earnings this week include a spate of potential market movers, including tech and tech-adjacent Alphabet Inc, Microsoft Corp, Meta Platforms Inc and Amazon.com. On the macroeconomic front, the first quarter Gross Domestic Product (GDP) and April Personal Consumption Expenditures (PCE) Price Index will be closely scrutinized in the second half of this week. In the meantime, the mid-tier US Conference Board Consumer Confidence data and housing data will entertain US Dollar traders.

The US Dollar Index, which tracks the USD performance against a basket of six major currencies, trades marginally higher on the day, near 101.50.

Technical analysis: US Dollar Index remains vulnerable

The US Dollar Index (DXY) is challenging the 101.50 psychological level on the road to recovery from weekly troughs. The recovery could gain traction if DXY manages to yield a daily closing above the bearish 21-Day Moving Average (DMA). It is worth noting that the index has failed to settle above the 21 DMA since March 15 on a daily candlestick closing basis.

Acceptance above the latter could initiate a fresh upswing toward the 102.50 psychological barrier, beyond which the confluence of the downward-sloping 50 and 100 DMAs at around 103.30 will be on buyers’ radars.

With the 14-day Relative Strength Index (RSI), however, still below the 50.00 level, the recovery attempts in DXY are likely to be sold into. Immediate support is seen at the intraday low of 101.19, below which the 101.00 round number will challenge the bullish commitments. Deeper declines will seek validation from the multi-month low reached on April 14 at 100.78.

How is US Dollar correlated with US stock markets?

Stock markets in the US are likely to turn bearish if the Federal Reserve goes into a tightening cycle to battle rising inflation. Higher interest rates will ramp up the cost of borrowing and weigh on business investment. In that scenario, investors are likely to refrain from taking on high-risk, high-return positions. As a result of risk aversion and tight monetary policy, the US Dollar Index (DXY) should rise while the broad S&P 500 Index declines, revealing an inverse correlation.

During times of monetary loosening via lower interest rates and quantitative easing to ramp up economic activity, investors are likely to bet on assets that are expected to deliver higher returns, such as shares of technology companies. The Nasdaq Composite is a technology-heavy index and it is expected to outperform other major equity indexes in such a period. On the other hand, the US Dollar Index should turn bearish due to the rising money supply and the weakening safe-haven demand.

Euro makes a date with year-to-date highs on the back of confidence-boosting bank earnings

Euro makes a date with year-to-date highs on the back of confidence-boosting bank earnings

The Euro (EUR) almost touches year-to-date highs above 1.1000 against the US Dollar (USD) during the early European session, on Tuesday. The single currency is supported by confidence-boosting Eurozone bank earnings, which suggest the sector has weathered the March crisis better than expected. Hawkish comments from rate-setters at the European Central Bank (ECB) further aid the Euro, as expectation of higher interest rates would lift capital inflows into Europe. From a technical perspective, despite an intraday pullback, the overall trend is up, with the probabilities favoring longs over shorts.

EUR/USD technical analysis: Nearing year-to-date highs

EUR/USD breaks out of a right-angled triangle (more clearly seen on the 4-hour chart) and unfolds another leg higher, in line with the broader medium-term uptrend that began over eight months ago. The pair is fast approaching the year-to-date highs at 1.1075. The odds favor a continuation of the dominant Euro bullish trend.


EUR/USD: Daily Chart

A decisive break above 1.1075, which was touched on April 14, would confirm a continuation of the Euro’s uptrend to the next key resistance level at around 1.1190, where the 200-week Simple Moving Average (SMA) sits.

For the sake of clarity, the definition of a ‘decisive break’ either includes a ‘breakout candle’ – a long green bullish daily candle that extends above the 1.1075 highs and closes near its high, or three smaller bullish green candles in a row that break above the highs.

Alternatively, a break and daily close below the key lower high at 1.0830 would bring into doubt the validity of the uptrend and could see losses extend down to a confluence of support at 1.0775-1.0800, marking a possible reversal of the dominant trend.

Singapore: Inflation lost momentum in March – UOB

Singapore: Inflation lost momentum in March – UOB

Senior Economist at UOB Group Alvin Liew reviews the latest inflation figures in Singapore.

Key Takeaways

“Headline and core CPI inflation eased and further converged in Mar 2023. Headline CPI rose by 0.5% m/m NSA, from 0.6% in Jan. Despite the m/m increase, CPI inflation rose at a slower pace of 5.5% y/y in Mar (from 6.3% in Feb). Similarly, core inflation (which excludes accommodation and private road transport) rose sequentially in Mar by 0.2% m/m (after staying flat in Feb at 0.0% m/m). Core inflation, like the headline, also eased noticeably in Mar despite the sequential increase, coming in at 5.0% y/y (from 5.5% y/y in Feb).”

“Inflation Outlook – The MAS kept its inflation forecasts (that were first made in the 14 Oct 2022 MPS) unchanged in today’s Mar CPI report, just as it did in the recent Monetary Policy Statement release (14 Apr). The central bank stated that “MAS Core Inflation will stay elevated in the next few months, as accumulated business costs continue to feed through to consumer prices”, and it also expected core inflation “to slow more discernibly in the second half of this year.”  The MAS also noted both upside and downside risks to inflation (versus just upside risks previously in the Feb 2023 CPI report). We continue to expect headline inflation to average 5.0% and core inflation to average 4.0% in 2023. Excluding the 2023 GST impact, we expect headline inflation to average 4.0% and core inflation to average 3.0%.”

EUR/USD retreats toward 1.1000 ahead of US data

EUR/USD retreats toward 1.1000 ahead of US data

EUR/USD is easing toward 1.1000 in the European session, having failed to sustain above 1.1050. The pair is heading south, as the US Dollar finds its feet amid a cautious market mood. Investors weigh ECB-speak, US consumer data and tech earnings ahead.

EUR/USD turned south after the Relative Strength Index (RSI) indicator on the four-hour chart rose above 70, suggesting that the pair’s latest pullback is a technical correction.

On the downside, 1.1000 (psychological level, static level, 20-period Simple Moving Average (SMA) and 50-period SMA) aligns as important support. A four-hour close below that level could attract technical sellers and trigger an extended decline toward 1.0950 (100-period SMA, Fibonacci 23.6% retracement) and 1.0900 (psychological level, static level).

1.1050 (static level) acts as interim resistance before 1.1075 (end-point of the latest uptrend) and 1.1100 (psychological level).

EUR/USD has staged a technical correction and declined below 1.1050 in the European morning after having touched a fresh 10-day high near 1.1070 earlier in the day. 1.1000 aligns as key support for the pair in the short term and sellers are likely to remain on the sidelines unless this level is broken.

The sharp decline witnessed in the US Treasury bond yields weighed on the US Dollar on Monday and provided a boost to EUR/USD. With the benchmark 10-year US Treasury bond yield losing more than 2% and falling below 3.5%, the US Dollar Index fell nearly 0.5% on the first trading day of the week.

Investors seem to be reacting to renewed concerns over the financing conditions after First Republic Bank’s earnings report revealed that the bank’s deposits plunged by more than $1000 billion in the first quarter.

Meanwhile, European Central Bank (ECB) Chief Economist Philip Lane said early Tuesday that it was still not the right time to stop raising rates but noted that further rate hike after next week’s policy meeting will depend on data.

Later in the session, the Conference Board’s consumer survey will be featured in the US economic docket. Rather than the headline Consumer Confidence Index, investors will pay close attention to the one-year inflation expectation component, which edged higher to 6.3% in March from 6.2% in February. A decline in that component could weigh on the USD and vice versa but the market reaction could remain short-lived ahead of this week’s key data releases from the US.

It’s also worth noting that Google and Microsoft will be releasing first-quarter earnings reports after the closing bell on Tuesday. Hence, market participants could stay away from risk-sensitive assets in the second half of the day and help the USD limit its losses.

S&P 500 & Nasdaq 100 Cautiously Anticipate Tech Earnings

S&P 500 & Nasdaq 100 Cautiously Anticipate Tech Earnings

SPX, NDX FUNDAMENTAL BACKDROP

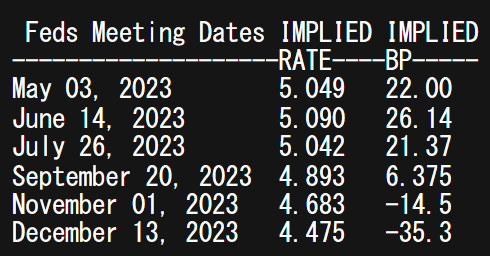
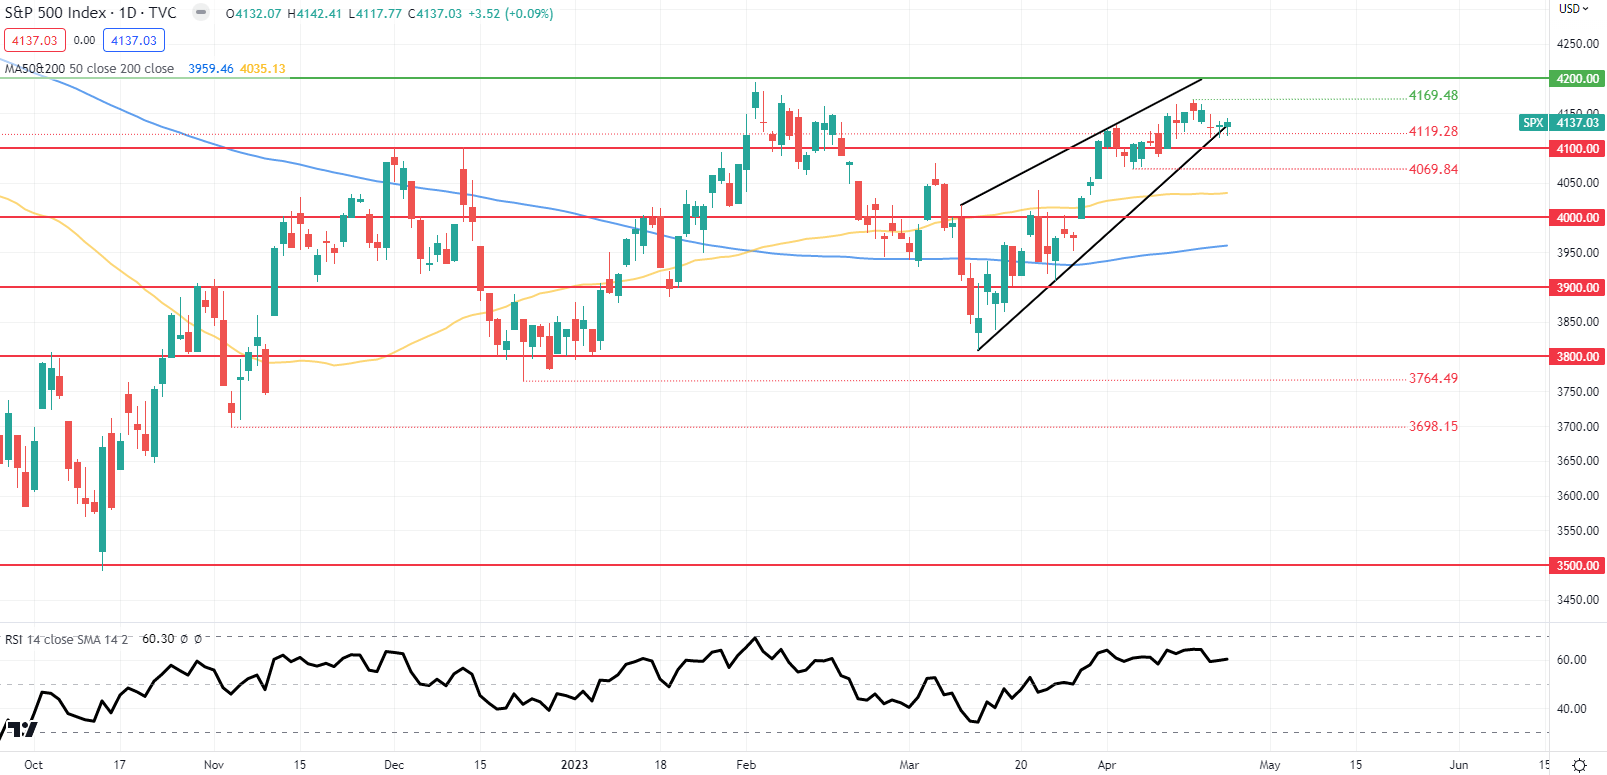
The S&P 500 and Nasdaq 100 index have been rather muted building up to this weeks tech earnings extravaganza. Equity futures are looking to open in the red during early European trade due to market apprehension as global recessionary fears gain traction. In 2023 thus far, tech stocks and the wider SPX index ignored an aggressive monetary policy environment by the Federal Reserve but now with hawkish Fed speak seen last week, investors are unsure as to the Fed’s outlook moving forward. Money markets are currently pricing in a 25bps rate hike next week with an almost 90% probability – generally a negative for stock valuations as the value of future earnings looks less appealing.

FEDERAL RESERVE INTEREST RATE PROBABILITIES

image1.png

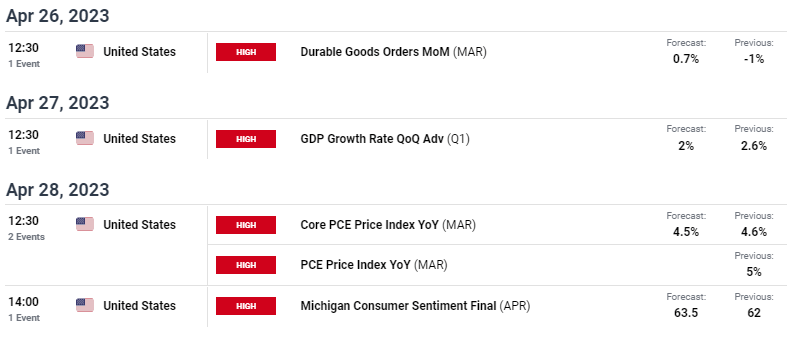
This week is as much about earnings as it is about US economic data and its impact on the Fed’s trajectory for 2023. The DailyFX economic calendar below outlines the high impact data that could shape the markets perception for future rate hikes. While many are anticipating a slowing US economy, anything marginally resilient or pointing to elevated inflationary pressures may open the door for additional interest rate hikes.

image2.png

SPX DAILY CHART

image3.png

Prospects for Gold and Silver Prices: Is It a Bullish Sign When Retail Traders Make More Bearish Bets?

Prospects for Gold and Silver Prices: Is It a Bullish Sign When Retail Traders Make More Bearish Bets?

In recent weeks, gold and silver prices have been struggling to find the momentum to resume the broader upside trajectory since bottoming last year. From a technical standpoint, while some bearish signals have emerged, the broader upside focus remains. But, from a positioning standpoint, perhaps there is continued support for upside progress.

This can be seen by looking at IG Client Sentiment (IGCS), which tends to be a contrarian indicator, especially in trending markets. In recent days, it seems retail traders have been increasing their downside exposure in gold and silver. Is this a sign that further gains might be in store?

Gold Sentiment Outlook – Bullish

The IGCS gauge shows that about 58% of retail traders are net-long gold. Since most of them are biased to the upside, this hints that prices may fall down the road. But downside exposure increased by 11.66% and 10.04% compared to yesterday and last week, respectively. With that in mind, recent changes in exposure hint that prices may soon resume higher.

XAU/USD Daily Chart

On the daily chart, gold broke under the 20-day Simple Moving Average (SMA). This followed the emergence of a Bearish Engulfing candlestick pattern, increasingly opening the door to extending downside progress. But, confirmation of the 20-day SMA breakout is lacking after the midpoint of the Fibonacci extension at 1977 held. This is maintaining the near-term upside bias. Extending lower exposes the 100-day SMA.

XAU/USD Daily Chart

Silver Sentiment Outlook – Bullish

The IGCS gauge reveals that 51% of retail traders are net-long silver. Since traders are net-long, this hints price may keep falling. But, net-short exposure has increased by 7.87% and 171.66% compared to yesterday and last week, respectively. With that in mind, recent changes in exposure warn that the current price trend may soon reverse higher.

XAG/USD Daily Chart

Silver prices also face the downside risk of a Bearish Engulfing candlestick pattern. But, unlike gold, XAG/USD has been unable to break under the 20-day SMA, leaving the precious metal in better technical standing than XAU/USD. Turning higher places the focus on April 2022 highs (25.85 – 26.21). Otherwise, falling under the SMA exposes the 50-day equivalent for key support.

XAG/USD Daily Chart

Can naive traders still make money? Optimizing Risk Management

Can naive traders still make money? Optimizing Risk Management

Not Quite Being Lucky

Often, there is an element of luck when it comes to trading. Even if your analysis is spot on, the timing is very difficult. A famous example from the real world can be found in Michael Burry, the storied US investor who correctly predicted the 2008 housing bubble from Michael Lewis’ bestseller “The Big Short”. He had to face down a revolt among his investors that nearly chased him out of the very trades that would land him in the history books. Burry’s financial backers balked at a steady stream of expensive payments made to keep his trades in play as the markets dithered.

There is a way for traders to compensate for luck – risk management. Overlooking this essential component of the strategy is how an incredibly lucky trader – someone who can frequently call trades correctly – may still lose money in the aggregate. Conversely, using risk management effectively is how a poor win rate can still translate into profitability.

How is it that a lucky trader can lose money overall? Consider a person who profited on 8 trades out of 10, making 10 dollars per trade. On the two remaining trades, however, 50 dollars were lost each time. On net, this will leave the trader 20 dollars poorer. In this special report, we will show how an unlucky trader can still be profitable, and what you can do to optimize risk management.

The First Random Walk – Understanding the Sequence

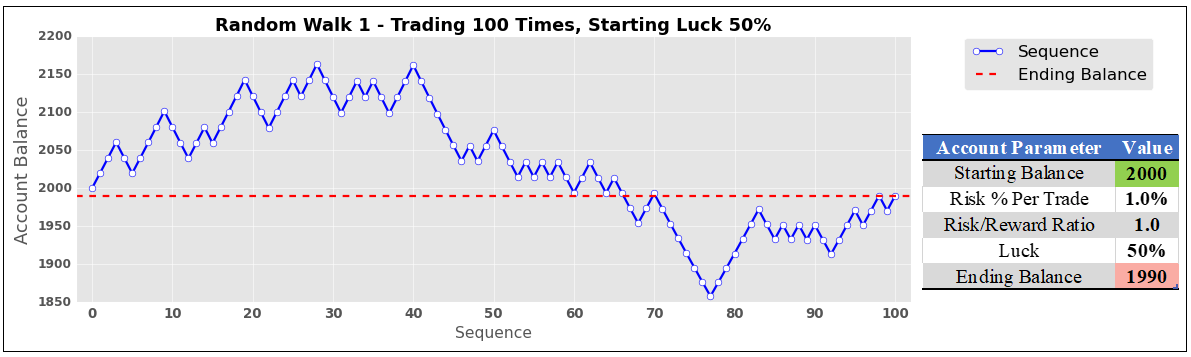
A random walk simulation was used to mimic someone trading 100 times in a row. Each random walk has a few parameters: starting account balance, the maximum risk a person is willing to take per trade as a percentage of the account balance (which stays the same as the trader makes or losses money), the risk-reward ratio (how much the trader wants to make relative to how much is put at risk), and finally the trader’s luck (the chance that a given trade in the sequence is profitable).

The first random walk is shown on the chart below. It simulates a trader that starts with a $2k account, risks 1% per trade, has a risk/reward (RR) ratio of 1:1 (meaning that the first trade risks losing $20 to make a profit of $20), and has 50% luck. Being lucky about half of the time had a predictable outcome. The ending balance ($1990) was nearly identical to where it started ($2000) after one hundred trades.
The First Random Walk – Understanding the Sequence

Study Limitations

It should be noted that this is a study computed with code and has no margin of error or human emotion factored into it. This means that no matter what, it assumes the trader being modeled always sticks to the game plan perfectly. It also assumes that trades can be seamlessly closed – with a profit or loss – at the designated settings with absolute precision. In the real world, stops may not always be executed at the specified price, resulting in some slippage. These simulations also assume 100 trades were taken, which will not match everyone’s level of activity. With that in mind, this is more of a demonstration of the importance of risk management rather than a one-size-fits-all trading system.

The Second Random Walk – Reducing Luck

What happens when we take the same sequence but make our hypothetical trader unlucky, leaving everything else unchanged? With 25% luck, disaster strikes. Someone with a risk/reward ratio of just 1:1 would see their account balance cut almost in half after 100 trades ($1137). As we will find at the end of this journey, however, an increase in the risk/reward ratio can compensate for worse luck.
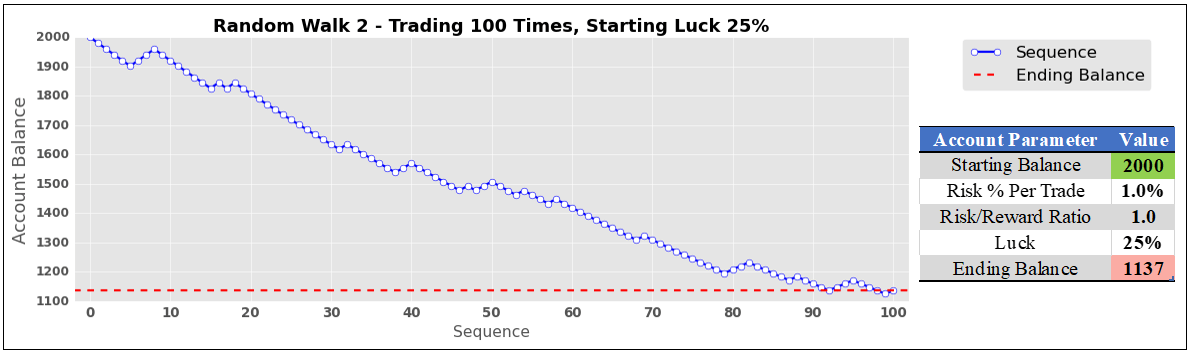
image2.png

Simulating Hundreds of Thousands of Trades to Find Optimal Risk/Reward Ratios

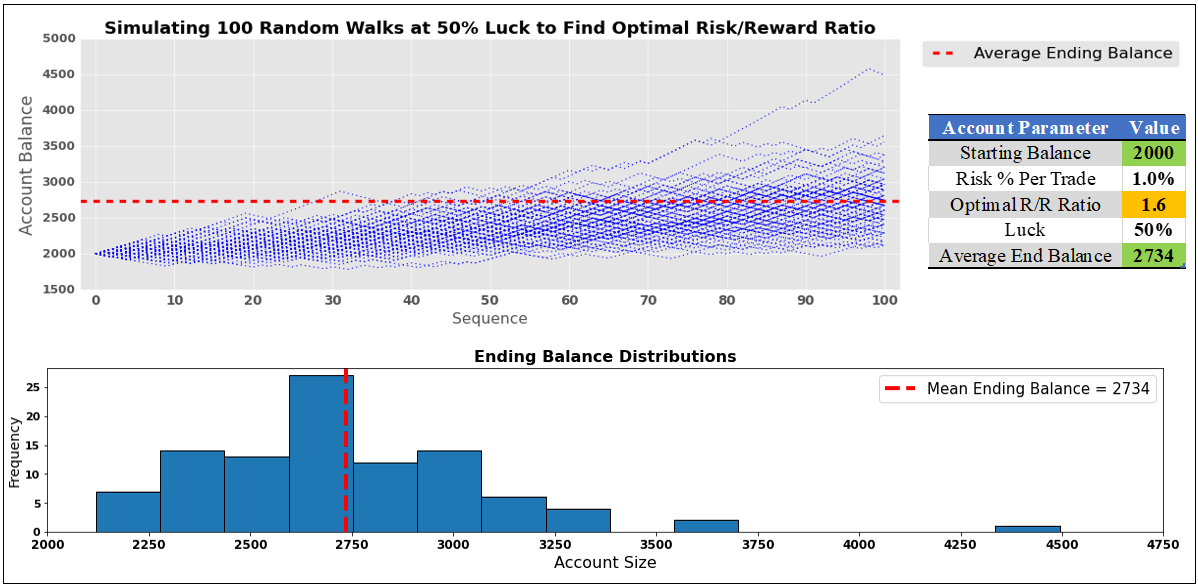
To find ideal risk/reward ratios for given levels of luck, these random walks were run many times to find statistically meaningful interpretations. In this study, one cycle constituted 100 trades conducted 100 times. That is a total of 10,000 trades per cycle! With each cycle, the risk/reward ratio automatically rose by 0.05, starting at 1. The program is coded to keep doing this until 100% of the trades are finished at or above the starting account balance.

So, what does this look like for someone lucky about half of the time? Well, in the image below, we can see that the optimal risk-reward ratio is on average 1.6 (meaning that with a starting balance of $2k the strategy aims to make $32 in profit while risking $20 on the first trade). The latter two will adjust alongside the evolving account balance to maintain a 1.6 RR ratio, making sure the risk remains at 1% per trade.

The code ended up increasing the risk/reward ratio 6 times. Including the starting point, the cycle ran 7 times. In other words, 70k trades were conducted to find the optimal RR ratio. To further optimize this study, another 10 rounds of random sequences were used. This means that roughly 770,000 trades were placed to find the optimal risk/reward ratio for 50% luck! It is not exactly 770,000 because sometimes the RR ratio was above/under 1.6.

When someone is lucky half of the time, and they use a 1.6 risk-reward ratio, we can expect an average ending balance of $2734 (36.7% return, which remains constant no matter what the starting account balance size is) after 100 trades. In the lower half of the image, there is a normal distribution of outcomes. There were a couple of outliers, with an account topping $4.5k. A few others were above $3.5k.
Simulating Hundreds of Thousands of Trades to Find Optimal Risk/Reward Ratios

The Optimal Risk/Reward Ratio Curve

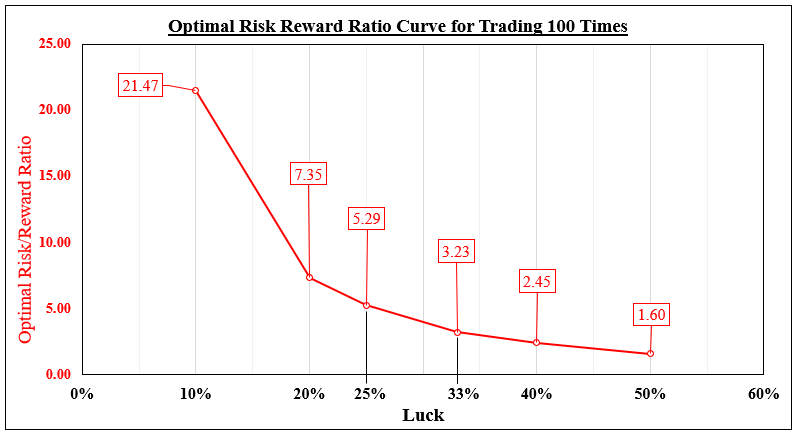
What about other levels of luck? In this study, I used the following: 50%, 40%, 33%, 25%, 20% and 10%. Optimal RR ratios are displayed in the chart below for a given luck level. As expected, lower levels of luck required higher risk/reward ratios to compensate. When you are lucky 40% of the time, an ideal RR ratio for a sequence of 100 trades seems to be 2.45.

At 2.45, a total of 30 cycles were simulated for a given random sequence. Just like before, an additional 10 were performed to help optimize this study. Combining all these sequences, roughly 3,300,000 trades were placed to find the optimal risk/reward ratio for 40% luck.

Someone lucky just 10% of the time can still make a profit. However, this would demand the daunting task of maintaining a 21.47 risk/reward ratio.
The Optimal Risk/Reward Ratio Curve

Is Trading Success Based on Luck?

Now, let us revisit the earlier scenario of a trader that is lucky just 25% of the time. Using a 1:1 risk-reward ratio, they lost almost half of their account. Using the optimal risk/reward ratio of 5.3 suggested in our analysis, their ending balance becomes $2844, a 42.2% return. Do traders have to be lucky to be profitable? Absolutely not. Success comes down to risk management.