British Pound Q2 2023 Technical Forecast: GBP/USD and EUR/GBP

British Pound Q2 2023 Technical Forecast: GBP/USD and EUR/GBP

The British Pound‘s technical outlook is neutral with the UK currency likely to be relatively stable to marginally firmer over the coming weeks. And that means we need to look at the dynamics of other major currencies to see if there are any potentially attractive set-ups against Sterling. Two currencies spring to mind, the US dollar and the Euro.

Both the US Federal Reserve and the Bank of England have hiked rates over the last year, keeping the interest rate differential between the two currencies roughly equal. Going forward this may change with the Fed likely to pause before starting to cut rates later this year while the BoE may have another hike before they pause. While the rate differential between the two currencies may not widen dramatically, sentiment may underpin GBP/USD.

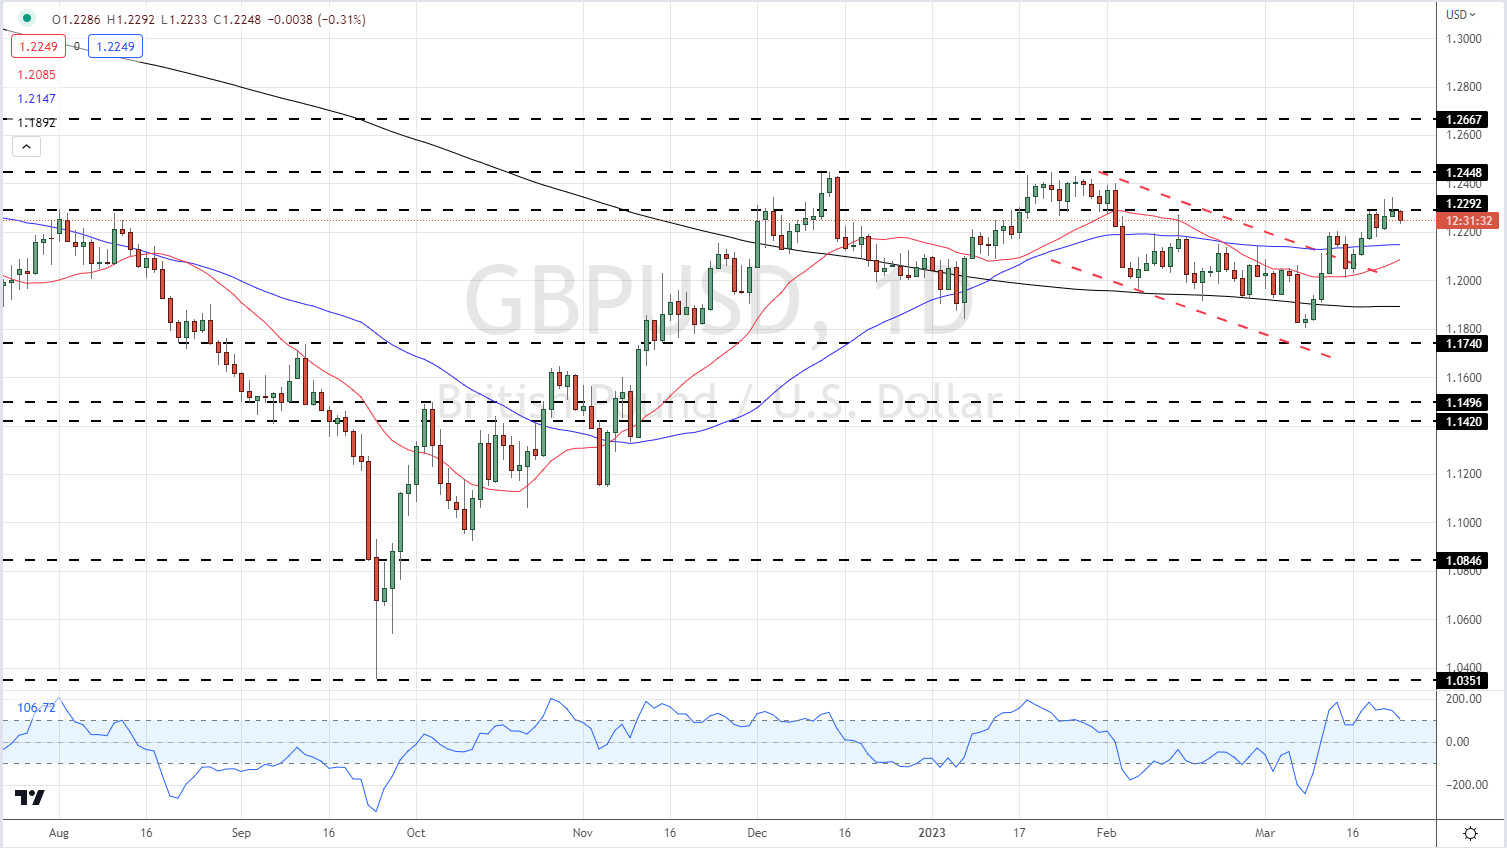
The daily GBP/USD chart shows how the pair has traded sideways over the past three months with cable currently eyeing the resistance at 1.2448. The moving average set-up is positive and should continue to underpin the move higher, while the recent series of higher lows indicate ongoing strength in the pair. If the pair breaks and opens above resistance at 1.2448, then a prior high at 1.2667 comes into play. Looking ahead, GBP/USD in Q2 may continue its sideways trade with a slight upside bias.

GBP/USD Daily Price Chart

image1.png

While Sterling may push higher against the US dollar, it is likely to struggle against the Euro, again on rate differential expectations. The European Central Bank has been very vocal about the need to continue hiking interest rates over the next few months in its ongoing battle against inflation and this will lead to the interest rate differential against the British Pound widening, favoring the Euro.

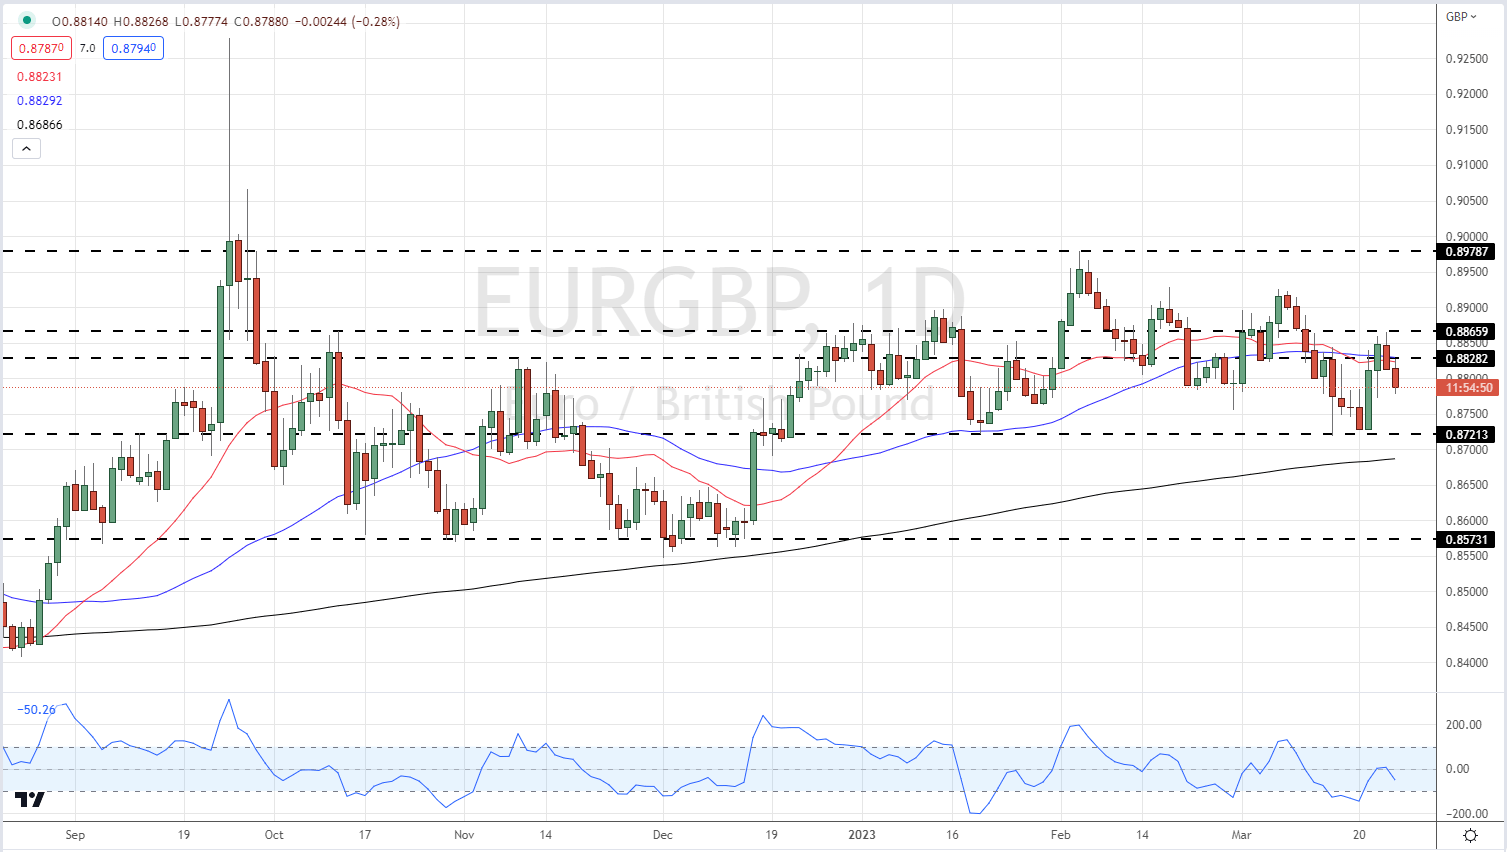
The Daily EUR/GBP chart again shows a fairly well-defined sideways pattern with support and resistance at 0.8712 and 0.8978 respectively. The support level looks reasonably strong having been tested and rejected over the last four months, and unless there is a fundamental change in the ECB’s thinking, or if a fresh Euro Area banking crisis hits, this level should hold. Just below support sits the 200-day moving average which will provide additional underpinning. A confirmed break above a recent double top around 0.8825/30 should allow the pair to re-test 0.8978 and potentially higher with little in the way of technical resistance above here.

EUR/GBP Daily Price Chart

image2.png

XAU/USD Forecast: Fed Beige Book Provides Support for Gold Prices

XAU/USD Forecast: Fed Beige Book Provides Support for Gold Prices

XAU/USD FUNDAMENTAL BACKDROP

Gold prices are stronger this Thursday morning on the back of a weaker US dollar. Despite hawkish commentary from the Fed’s Williams who cited the tough task lying ahead to bring down inflation as well as the robust labor market in the US, markets reacted to the Fed Beige Book. The Fed Beige Book is a report produced 8 times per year and includes data from around the US from bank and branch directors on the economic conditions in various regions. Yesterday’s report outlined a fading US economy with declining inflationary pressures and tighter credit access. Recessionary fears have also gained traction which could be playing into bullions safe-haven appeal.

The report may also insinuate the need for the Federal Reserve to pause its interest rate hiking cycle after the May meeting; however, according to money market pricing (see table below), expectations remain set for yet another hike in June.

FEDERAL RESERVE INTEREST RATE PROBABILITIES

image1.png

Subsequently, US real yields have slipped on the notion of a possible earlier peak in interest rates with both the 10 and 2-year US Treasury yields down. The reduction in opportunity cost of holding the yellow metal makes it more attractive from an investor standpoint.

U.S. 10-YEAR TIPS – REAL INTEREST RATE

image2.png

Upcoming data today includes jobless claims data (see economic calendar below) which is expected to come roughly in line with the prior week. If this comes to fruition I don’t see much impact from a market volatility perspective but Fed speak a little later on could stoke the markets. This week has had some aggressive Fed speak from its speakers and a continuation of that narrative could give the greenback a boost, leaving gold exposed on the downside.

ECONOMIC CALENDAR

image3.png

TECHNICAL ANALYSIS

XAU/USD DAILY CHART

image4.png

Daily XAU/USD price action although in the green today, remains below the psychological $2000 handle. This could be the beginning of bearish divergence playing out opening up room towards subsequent support zones.

IG Client Sentiment in USD/CAD: For the first time since Apr. 10, 2023, 19:00 GMT, when USD/CAD traded near 1.35, our data indicate that traders are now net-short USD/CAD.

IG Client Sentiment in USD/CAD: For the first time since Apr. 10, 2023, 19:00 GMT, when USD/CAD traded near 1.35, our data indicate that traders are now net-short USD/CAD.

USD/CAD: Retail trader data shows 49.42% of traders are net-long with the ratio of traders short to long at 1.02 to 1. In fact, traders have remained net-short since Apr 10 when USD/CAD traded near 1.35, price has moved 0.31% lower since then. The number of traders net-long is 20.57% lower than yesterday and 13.10% lower from last week, while the number of traders net-short is 23.91% higher than yesterday and 27.18% higher from last week.

We typically take a contrarian view to crowd sentiment, and the fact traders are net-short suggests USD/CAD prices may continue to rise.

Our data shows traders are now net-short USD/CAD for the first time since Apr 10, 2023 19:00 GMT when USD/CAD traded near 1.35. Traders are further net-short than yesterday and last week, and the combination of current sentiment and recent changes gives us a stronger USD/CAD-bullish contrarian trading bias.

Number of traders net-short has increased by 27.18% from last week.

SYMBOL TRADING BIAS NET-LONG% NET-SHORT% CHANGE IN LONGS CHANGE IN SHORTS CHANGE IN OI
USD/CAD BULLISH 49.42% 50.58% -20.57% Daily

-13.10% Weekly

23.91% Daily

27.18% Weekly

-2.95% Daily

3.47% Weekly

The Smile of the US Dollar: How Does USD Drive Economic Resilience or Recession?

The Smile of the US Dollar: How Does USD Drive Economic Resilience or Recession?

A “floating” currency – or one that is influenced by the natural forces of the market – tends to have a positive relationship with its economy. In other words, if growth is expected to outperform and bolster inflation, causing the central bank to raise interest rates, that tends to boost the currency and vice versa. There are always exceptions, however, such as the US Dollar.

Have you ever heard of the “Dollar Smile Theory”? This is a concept that helps explain why the US Dollar tends to rise when the economy is not only strongly outperforming, but also when it is experiencing trouble, such as a recession. Everything in between these two extremes is where the currency often finds itself under pressure.

To understand why this relationship exists, you need to have a basic understanding of the US Dollar’s unique role in global financial markets. It is the global reserve currency. According to the Bank for International Settlements, in 2019 the USD was used in about 90% of global FX transactions. This means it is the world’s most liquid trading instrument.

The saying goes when the US sneezes, the world catches a cold. During times of economic stress, flight to safety means traders often need to liquidate market positions. Their go-to choice is often US Dollars, making it a haven-linked trading instrument. This influx of demand helps explain why the currency tends to rise during recessionary periods. Compared to a handful of assets, the US Dollar tends to do the best during the onset of recessions in the United States.

The chart below visualizes the “Dollar Smile Theory”. But, how can you use this information to your advantage? Well, the purpose of this article is to quantify the concept and show you how this relationship works in the real world. I will be looking at the dollar’s interaction with the following economic data: gross domestic product (GDP), the unemployment rate, ISM manufacturing PMI, and vehicle sales. By the end of the article, hopefully, you can walk away with a better understanding of USD.

US Dollar Smile Theory

US Dollar Smile Theory

Setting Some Ground Rules

Before diving into economic data, let us set some ground rules. The first is that all the data is quarterly since 1976 expressed in year-over-year terms. The second is that for each economic indicator, I have removed extreme outliers (beyond +- 3 standard deviations from the average). What is left behind is underlying data matching an underlying US Dollar.

This helps increase the statistical significance and reduce variability. Also, for the most part, each economic indicator will have outliers removed from different quarters. Finally, I will be using the Bloomberg Correlation-Weighted US Dollar Index (BCWI). This is because I want to capture the general movement in the currency as opposed to a given exchange rate.

Testing Gross Domestic Product (GDP)

Can you spot the “U-shaped” relationship between GDP (or economic growth) and the US Dollar below? That is the smile theory put into action with real economic data. The curve can be broken down into two green zones on the left and right (where USD is expected to be positive for given values of GDP), and a red zone (where the currency is anticipated to weaken). Somewhere between 1.5% – 4.0% GDP (Y/Y) is the “damage” zone for USD, or when the currency is seen falling compared to a year ago. Values of growth outside of this range show USD rising on average.

It should be noted that there is a plethora of factors that can impact how the USD performs in a quarter compared to a year ago. That is why sometimes you will see the dollar doing well around the “red zone” of GDP and poorly in the “green zone”. The purpose of this study is to focus on just the economic indicator alone, highlighting a non-linear relationship with the US Dollar.

GDP YoY Quarterly Since 1976 (Outliers Removed)

GDP YoY Quarterly Since 1976 (Outliers Removed)

Testing the Unemployment Rate

What about the unemployment rate? Like GDP, there is also a “U-shape” relationship with the US Dollar. The tricky thing here is that you need to think about unemployment in reverse terms compared to GDP. When the unemployment rate is rising, that is not good for an economy and vice versa.

In this data, it seems the “danger” zone for the US Dollar is when the unemployment rate is seen performing somewhere between -5% and +25% (Y/Y). When this economic indicator clocks in outside of this range, the US Dollar has historically tended to rise against its major counterparts.

Unemployment Rate YoY Quarterly Since 1976 (Outliers Removed)

Unemployment Rate YoY Quarterly Since 1976 (Outliers Removed)

Testing ISM Manufacturing PMI

Now let us look at ISM Manufacturing PMI to gauge the impact of activity in the industrial sector on the currency. Here too you can find a “U-shaped” relationship. It seems that the “danger” zone for the US Dollar is when this indicator performs -5% to +30% (Y/Y). Outcomes outside of this range seem to open the door for the US Dollar to outperform.

ISM Manufacturing PMI YoY Quarterly Since 1976 (Outliers Removed)

ISM Manufacturing PMI YoY Quarterly Since 1976 (Outliers Removed)

Testing Vehicle Sales

Finally, I will wrap this up with the total number of new vehicle sales, expressed in year-over-year terms. Just like GDP, the unemployment rate and ISM manufacturing PMI, you can also see a “U-shaped” relationship with the US Dollar. The “danger” zone for the currency seems to occur when vehicle sales report between -7.5% and +7.5%. Meanwhile, the US Dollar on average tends to appreciate when outcomes are outside of this zone.

Vehicle Sales YoY Quarterly Since 1976 (Outliers Removed)

Vehicle Sales YoY Quarterly Since 1976 (Outliers Removed)

Conclusion

With that in mind, hopefully, you have a better idea of what the US Dollar Smile Theory is and how it works in real life. The key takeaway is that the currency tends to appreciate handsomely when economic data greatly outperforms and significantly underperforms, such as during recessions. Somewhere in-between these extreme outcomes are where the currency tends to weaken, and I tried to quantify that for you. If you have enjoyed this special report, feel free to follow me on Twitter for ongoing updates!

Is Euro’s Rally Stalling? Price Action in EUR/USD, EUR/JPY, EUR/GBP

Is Euro’s Rally Stalling? Price Action in EUR/USD, EUR/JPY, EUR/GBP

The euro’s rally against the US dollar could be stalling as it runs into a stiff hurdle even as expectations for further tightening by the European Central Bank (ECB) grow.

Expectations of further interest rate increases by the ECB have risen as the concerns regarding the banking sector have eased. Moreover, ECB commentary has been hawkish recently – German central bank chief Joachim Nagel said ECB needs to raise rates as rapid price growth was at risk of getting entrenched. French central bank chief Francois Villeroy de Galhau said there is room for rate hikes in coming meetings, echoed by ECB chief economist Philip Lane.

EUR/USD Weekly Chart

image1.png

Euro area core inflation hit a record high of 5.7% in March and could still rise further before peaking. Long-term inflation expectations in the Euro area rose to a one-month high. As a result, markets are currently pricing in about 3 ECB rate hikes of 25 basis points each by September, and fully priced in for a 25-basis point hike at the next meeting. At the same time, markets are pricing in an 84% chance for a 25-basis points hike by the US Fed in May.

EUR/USD Daily Chart

image2.png

Note: In the above colour-coded chart, Blue candles represent a Bullish phase. Red candles represent a Bearish phase. Grey candles serve as Consolidation phases (within a Bullish or a Bearish phase), but sometimes they tend to form at the end of a trend. Note: Candle colors are not predictive – they merely state what the current trend is. Indeed, the candle color can change in the next bar. False patterns can occur around the 200-period moving average, or around a support/resistance and/or in sideways/choppy market. The author does not guarantee the accuracy of the information. Past performance is not indicative of future performance. Users of the information do so at their own risk.

Better-than-expected China GDP data has supported EUR given the strong manufacturing sector linkages with the world’s second-largest economy. The economy grew 4.5% on-year in the January-March quarter, well above 4% expected, and 2.9% in the previous quarter.

EUR/USD: Uptrend in place, but some signs of fatigue

On technical charts, EUR/USD’s trend on the daily charts remains up, as the colour-coded candlestick charts (based on trending/momentum indicators) suggest. The rebound last month from near-strong support at the January low of 1.0480 has kept intact the higher-top-higher-bottom pattern since September.

EUR/USD 240-minute Chart

image3.png

Having said that, EUR/USD faces tough resistance at the early February high of 1.1035, not too far from the 200-week moving average (now at about 1.1200). A negative divergence (rising price associated with flattening 14-week Relative Strength Index) on the weekly charts suggests EUR/USD’s month-long rally is losing steam. Still, the upward pressure is unlikely to ease while the pair holds above the 1.0800-1.0900 area on the 240-minute charts.

EUR/JPY Daily Chart

image4.png

EUR/JPY: Barrier ahead

EUR/JPY’s break this month above key resistance on a horizontal trendline from early March (that came at about 145.50) confirms that the minor trend is up within the overall upward-sloping channel since May 2022. However, unless the cross breaks above the October high of 148.40, the broader trend is at best sideways to marginally up. Subsequent resistance is on the upper edge of the channel (now at about 150.50).

EUR/GBP Daily Chart

image5.png

EUR/GBP: Boxed in a range

EUR/GBP has essentially been range bound since the start of 2023. The upper edge of the range is defined by a horizontal trendline around 0.8900, while the lower edge of the range is a horizontal trendline from January at about 0.8700, near the 200-day moving average. Any breakout from the range could lead to a move of 0.0200 (the width of the range) in the direction of the breakout.

What amount More Disadvantage in New Zealand Dollar? Setup of prices in NZD/USD, AUD/NZD, and EUR/NZD.

What amount More Disadvantage in New Zealand Dollar? Setup of prices in NZD/USD, AUD/NZD, and EUR/NZD.

The New Zealand dollar has fallen sharply against the US dollar following a softer-than-expected inflation reading. However, relative monetary policy outlooks and technical charts suggest further downside in NZD/USD could be limited.

New Zealand inflation slowed more than expected in Q1-2023, softening to 6.7% on-year Vs 6.9% expected, down from 7.2% in Q4-2022. While inflation has eased, it may not be enough for RBNZ to press the pause button just yet. Money markets are pricing in one more RBNZ hike in May. Earlier this month, RBNZ raised interest rates by a bigger-than-expected 50 basis points while remaining hawkish as price pressures remain around three-decade highs.

NZD/USD 240-minute Chart

image1.png

Chart Created Using TradingView

In contrast, the US Federal Reserve could pause sooner compared with the RBNZ (several policymakers considered holding rate increases at last month’s meeting) as US core inflation measures are stabilizing. Money markets expect the Fed to proceed with one more rate hike next month but expect the Fed to cut rates later this year. Unless the Fed turns incrementally hawkish or RBNZ turns dovish, the downside in NZD/USD could be limited.

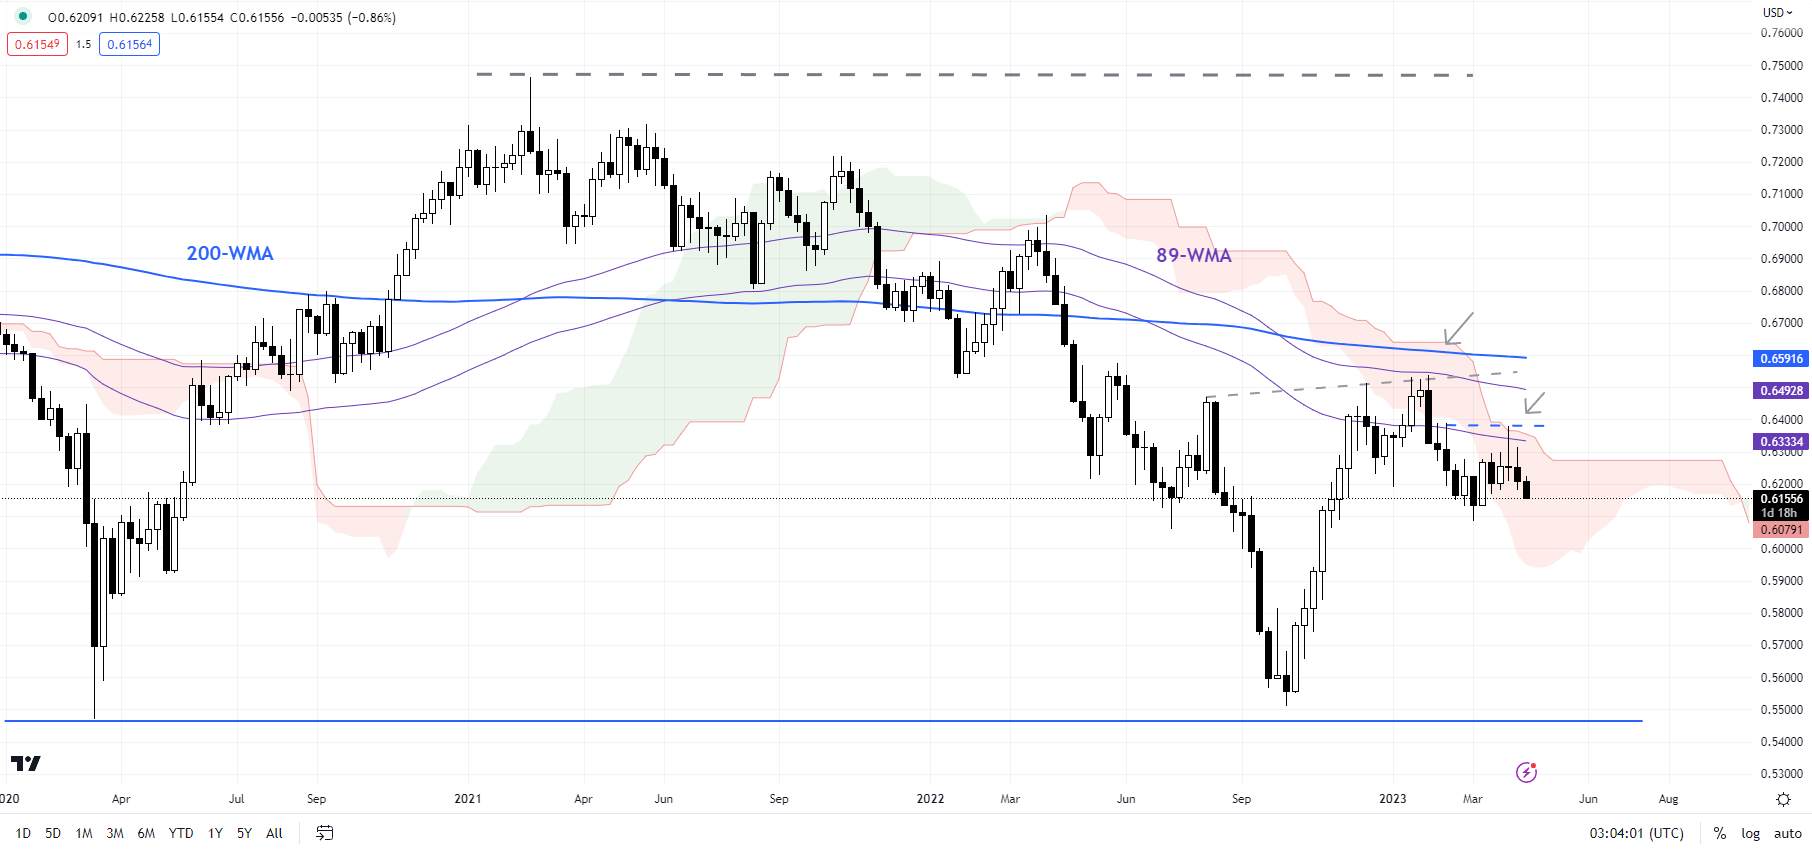
NZD/USD Weekly Chart

image2.png

Chart Created Using TradingView

NZD/USD: Strong support at the March low

Starting with the big picture, the lower high staged earlier this month indicates that the downward correction that started in February isn’t over yet (see the weekly chart). Earlier this month, NZD/USD failed to rise above crucial resistance on the 89-day moving average and the 89-week moving average, coinciding with the upper edge of the Ichimoku cloud cover on the daily and weekly charts.

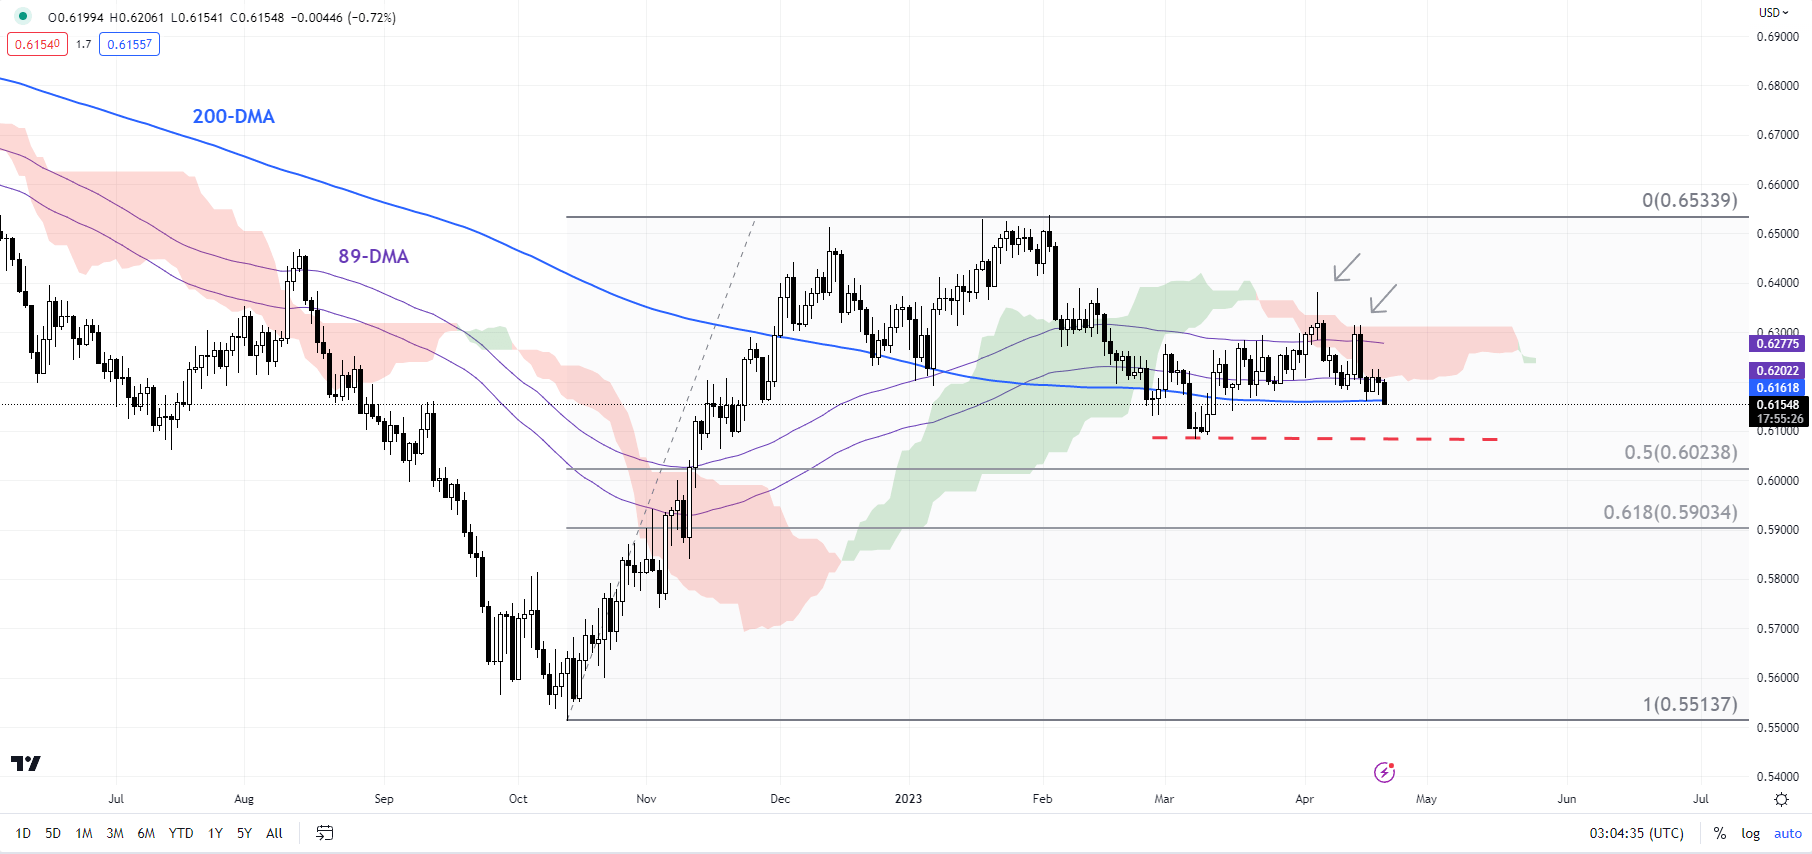
NZD/USD Daily Chart

image3.png

Chart Created Using TradingView

NZD/USD is now approaching quite strong support at the March low of 0.6085. Given the V-shaped rebound in the last quarter of 2022 (that is, a 100% retracement of the August-October slide), a hold above the vital floor at 0.6085 can’t be ruled out. Below 0.6085, the next support is at 0.6000 (the 50% retracement of the end of 2022 rise) followed by 0.5900 (the 61.8% retracement).

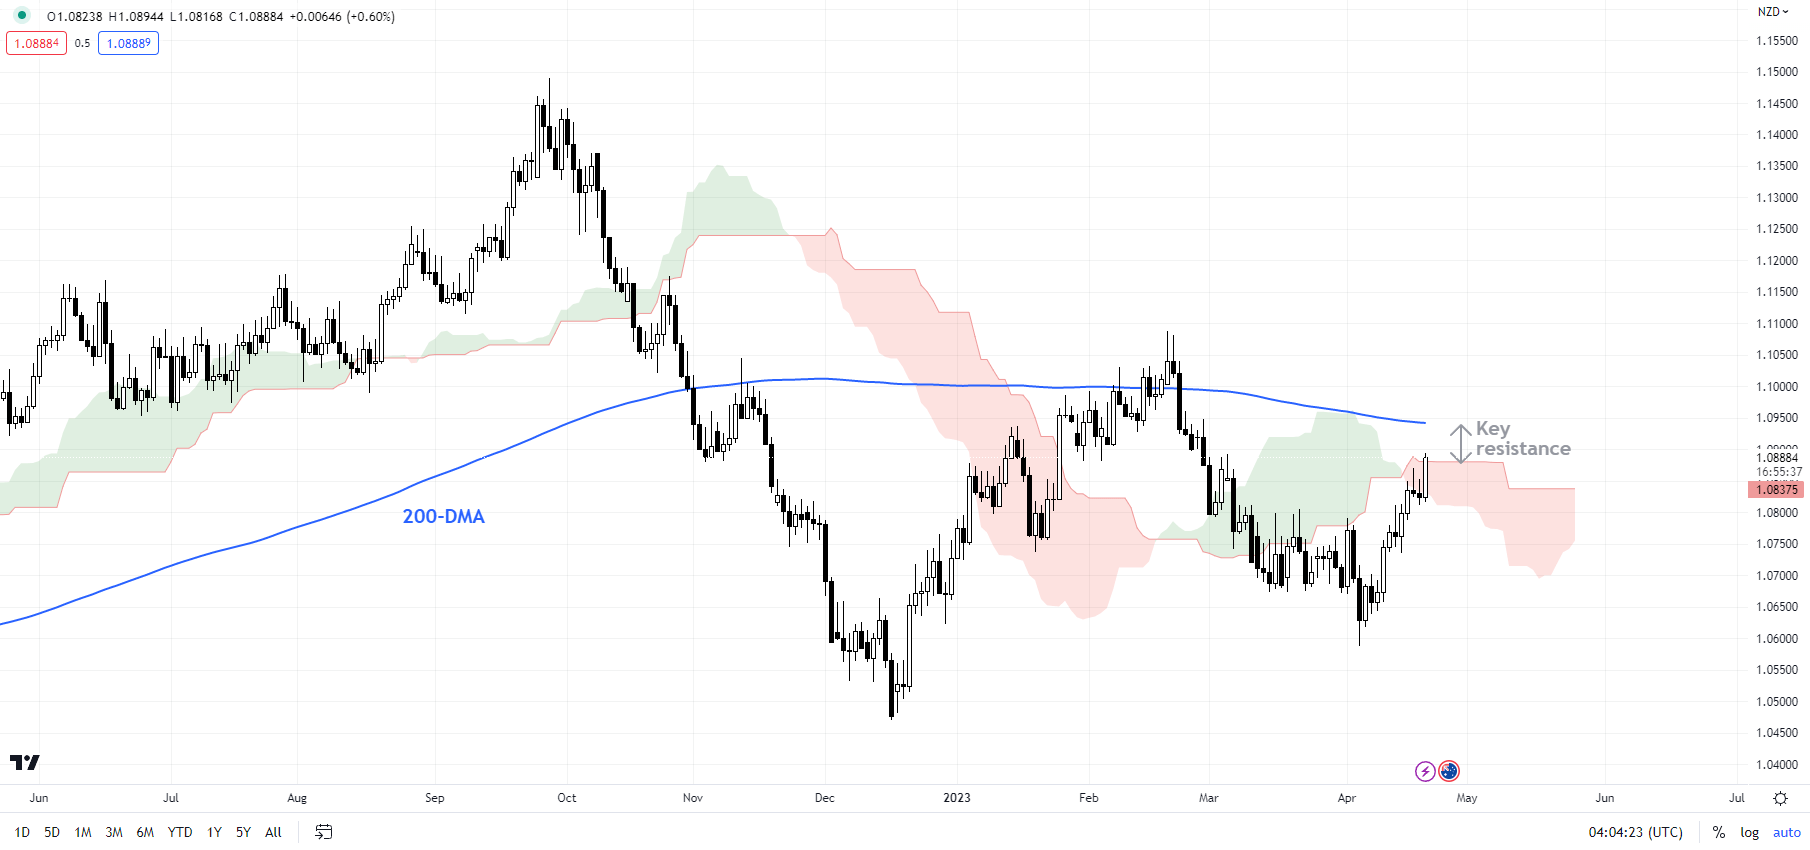
AUD/NZD Daily Chart

image4.png

Chart Created Using TradingView

AUD/NZD: Key hurdle ahead

AUD/NZD’s break last week above key resistance at the early-April high of 1.0790 confirms that the downward pressure has faded for now. However, AUD/NZD has plenty of resistance, starting with the 89-day moving average, the upper edge of the Ichimoku cloud on the daily charts, and the 200-day moving average. For the outlook to turn bullish, AUD/NZD would need to break above the February high of 1.1085.

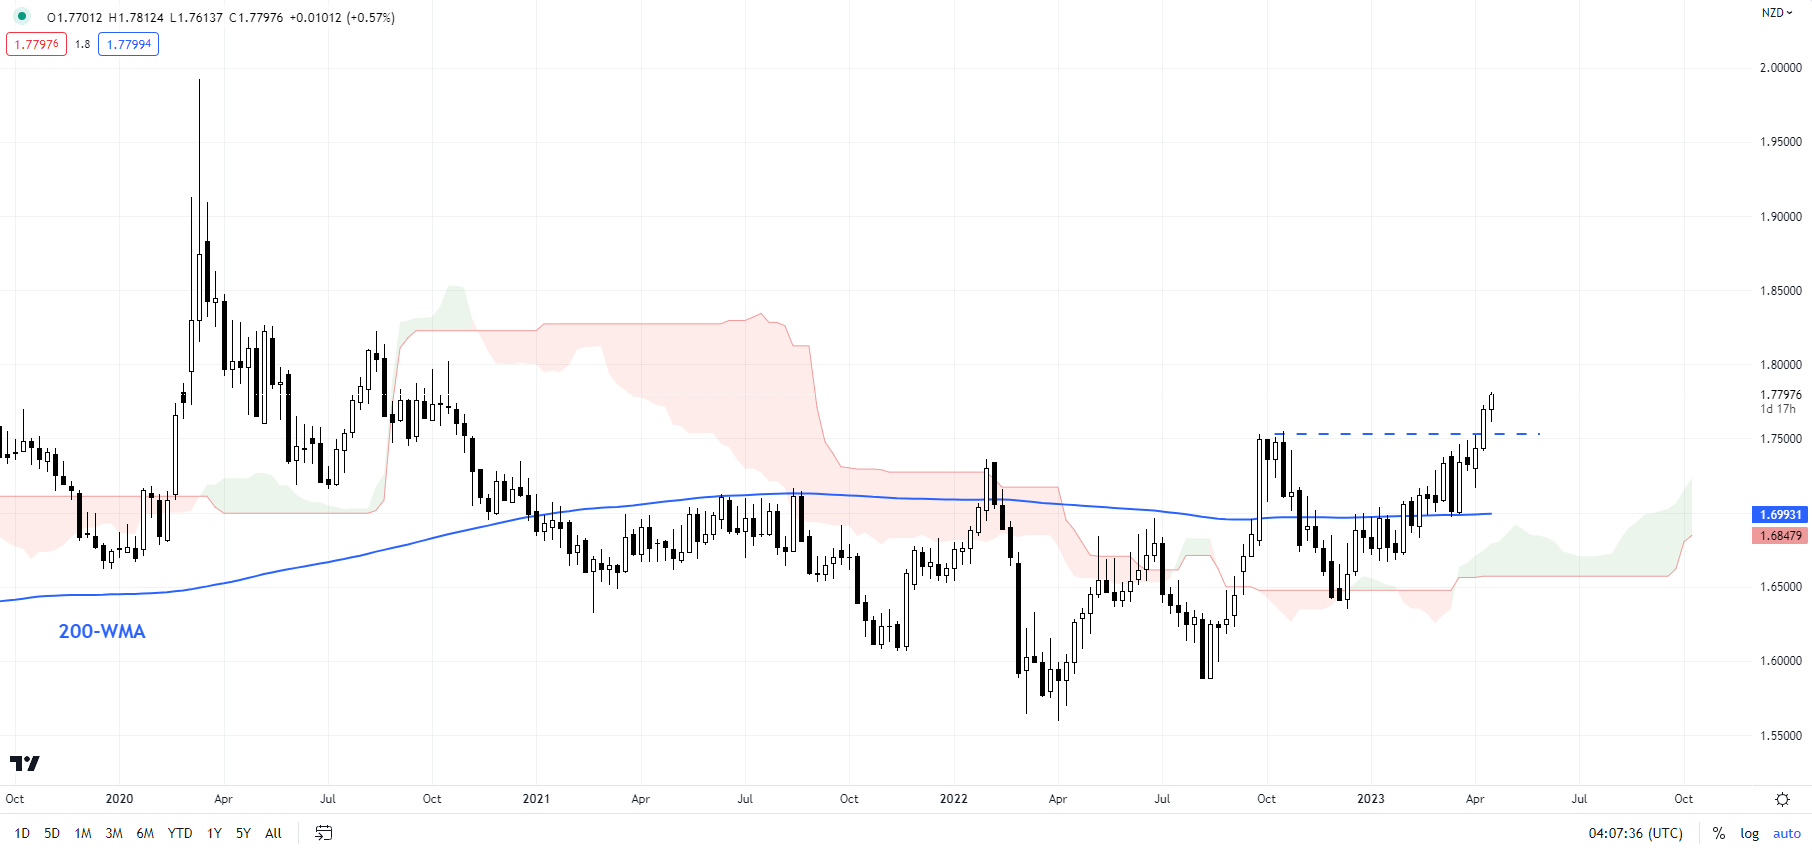
EUR/NZD Weekly Chart

image5.png

Chart Created Using TradingView

EUR/NZD: Breaks higher

EUR/NZD’s break above key resistance at the October high of 1.7550 has opened the way toward the late 2020 high of 1.8225. The hold last year above the Ichimoku cloud on the weekly charts coupled with the break above the 200-week moving average confirms that the trend is up.

XAU/USD Forecast: Fed Beige Book Provides Support for Gold Prices

Gold (XAU/USD) Price Under Yield Pressure, Support Level Nears

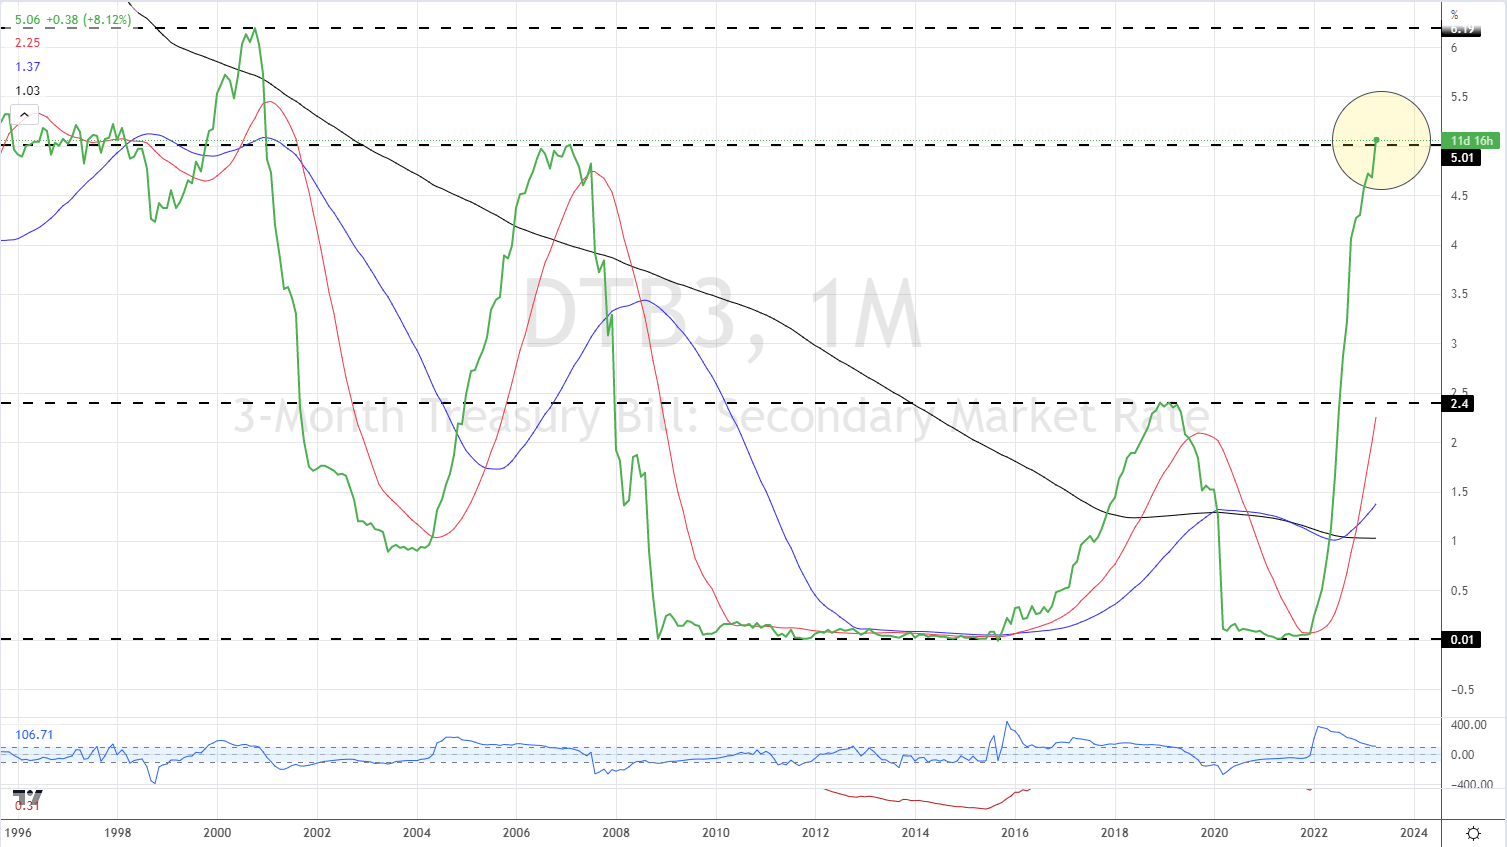
From building for a test of a new all-time high to testing prior levels of resistance in a matter of a few days, gold traders need to re-assess the reasons behind the precious metals’ move. The re-pricing of US rate expectations continues with short-dated yields continuing to push higher. The yield on the 3-month UST Bill is now above 5%, back at the highest level seen since January 2001, and up nearly 500 basis points from January 2022. This short-term rate re-pricing is weighing on gold.

US Treasury 3-Month Bill Yields Monthly Price Chart – April 19, 2023

image1.png

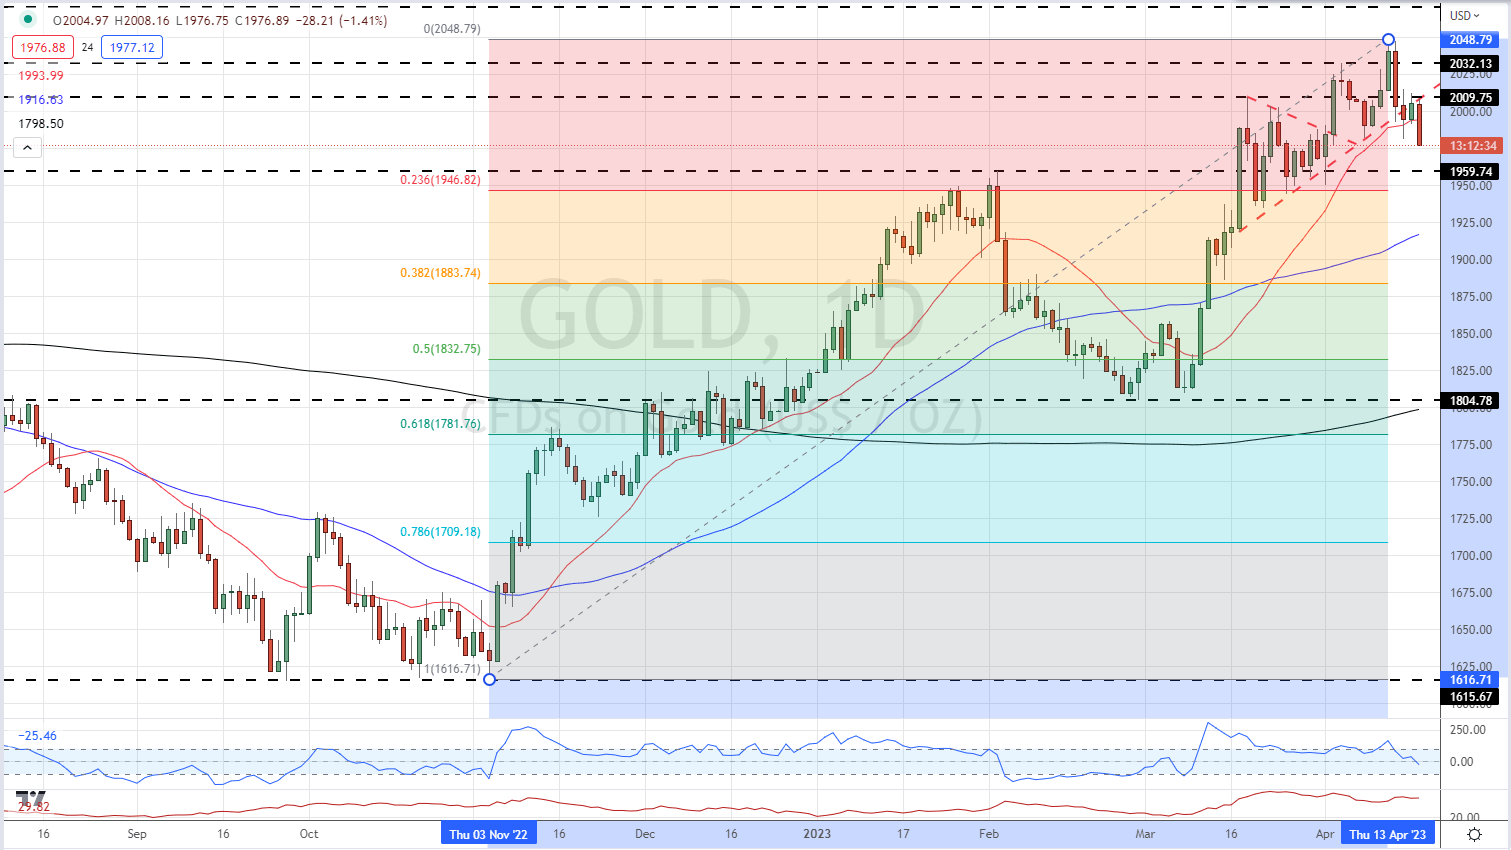
Gold is now looking at an important support level near $1,961/oz, a prior level of resistance that turned into support. If this level is broken then the 23.6% Fibonacci retracement level at $1,947/oz. comes into play. It is likely that this level will hold once the current bout of rising UST yields abates. Resistance is seen around $2,009/oz. before $2,048/oz.

Gold Price Daily Chart – April 19, 2023

image2.png

Retail trader data show 57.52% of traders are net-long with the ratio of traders long to short at 1.35 to 1.The number of traders net-long is 5.28% lower than yesterday and 0.95% higher from last week, while the number of traders net-short is 7.52% higher than yesterday and 3.44% lower from last week.

We typically take a contrarian view to crowd sentiment, and the fact traders are net-long suggests Gold prices may continue to fall. Positioning is less net-long than yesterday but more net-long from last week. The combination of current sentiment and recent changes gives us a further mixed Gold trading bias.

US Dollar Q2 Technical Forecast: Sellers Take Hold of Steering Wheel

US Dollar Q2 Technical Forecast: Sellers Take Hold of Steering Wheel

The U.S. dollar, as measured by the DXY index, was on a roller coaster ride during the first three months of the year. Early in February, the index fell below the 101.00 and hit its weakest mark in about 10 months, but then managed to recover rapidly, reaching its best level since November 2022 in a reprieve that proved to be short-lived. The tug of war between bulls and bears was voracious, with the latter group eventually prevailing.

Confluence Resistance Halts Bulls

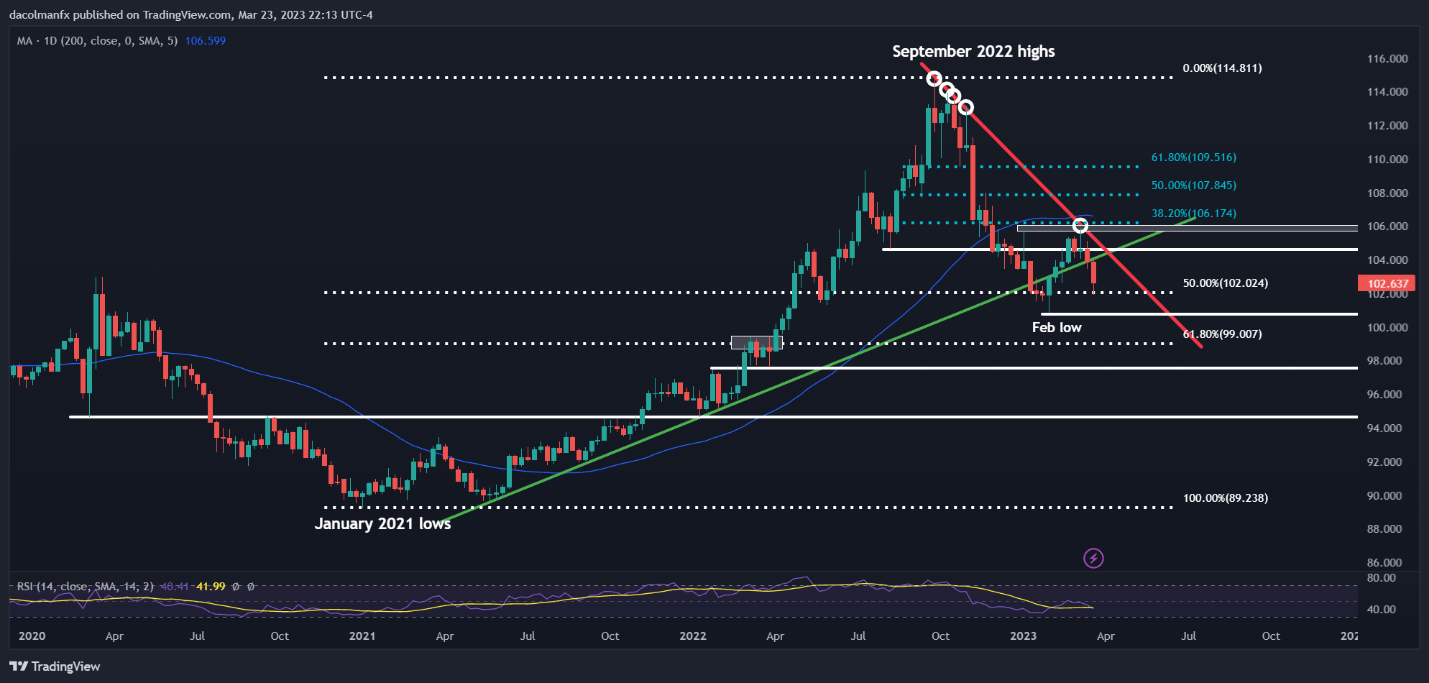
The February-March rally stalled at confluence resistance, just a touch below the psychological 106.00 handle. In this zone, the 38.2% Fibonacci retracement of the September 2022/February 2023 slump converges with a medium-term descending trendline that has been guiding the greenback’s decline for the past six months.

After failing to clear the 106.00 technical ceiling, the U.S. dollar index pivoted lower as upside momentum vanished as quickly as it appeared, allowing bears to regain decisive control of the market. With downside pressure accelerating in late March, prices have dropped to a key support around the 102.00 level, which corresponds to the Fibonacci retracement of the January 2021/September 2022 advance.

Breakdown on the Horizon

At the time of writing, DXY continues to trade above the 102.00 handle, but a breakdown seems in the offing. Should this scenario play out, sellers could launch an attack on February’s low at 100.82. Below that, the next floor rests at 99.00, the 68.2% Fib retracement of the 2021/2022 move discussed before. On further weakness, subsequent technical supports are seen at 97.60 and 94.70.

In the event of a bullish reversal, which at this point seems unlikely given the growing negative sentiment around the greenback, prices need to overcome resistance ranging from 104.00 to 104.65 to be sure that the medium-term downward correction is completely over. If the 104.00/104.65 area is taken out, upside impetus could pick up pace, paving the way for a rally toward 106.17, followed by 107.85.

US Dollar (DXY) Chart – Weekly Timeframe

Chart, histogram  Description automatically generated

Source: TradingView, Prepared by Diego Colman

AUD/USD lacks firm intraday direction, flat-lines above 0.6700 amid modest USD strength

AUD/USD lacks firm intraday direction, flat-lines above 0.6700 amid modest USD strength

The AUD/USD pair struggles to capitalize on the previous day’s positive move and seesaws between tepid gains/minor losses through the early European session. The pair is currently placed just above the 0.6700 round-figure mark, nearly unchanged for the day, and remains below a technically significant 200-day Simple Moving Average (SMA).

A combination of factors assists the US Dollar (USD) to attract some intraday buying, which, in turn, is acting as a headwind for the AUD/USD pair. Speculations that the Federal Reserve (Fed) will continue raising interest rates remain supportive of the recent rally in the US Treasury bond yields. In fact, the yield on the benchmark 10-year US government bond and the rate-sensitive two-year US Treasury note climb to over a four-week high. This, along with a generally weaker tone around the equity markets, helps revive demand for the safe-haven Greenback and contributes to capping the upside for the perceived riskier Aussie.

That said, the uncertainty over the Fed’s rate-hike path holds back the USD bulls from placing aggressive bets and lends some support to the AUD/USD pair. It is worth mentioning that several Fed officials called for more hikes and the markets have nearly priced in a 25 bps lift-off in May. The Fed funds futures, however, indicate only a small chance of another rate hike in June. Apart from this, a lower probability of a recession in Australia, along with the hawkish tone from the Reserve Bank of Australia’s (RBA) April meeting minutes and the upbeat China macro data, should limit the downside for the Australian Dollar.

The aforementioned mixed fundamental backdrop, meanwhile, warrants caution for aggressive traders and before positioning for a firm near-term direction for the AUD/USD pair. In the absence of any relevant market-moving economic data from the US on Wednesday, investors will focus on the release of the Fed’s Beige Book, due later during the US session, for the central bank’s take on the state of the US economy. This, along with the US bond yields and the broader risk sentiment, should influence the USD price dynamics and allow traders to grab short-term opportunities around the AUD/USD pair.

China wants weaker US dollar as reserve currency, says Biden economist nominee

China wants weaker US dollar as reserve currency, says Biden economist nominee

There was “some evidence” that China wants the dollar to weaken as the international reserve currency, said a White House nominee for a top economist position on Tuesday, and he urged Congress to raise the U.S. debt ceiling to protect the dollar’s value.

Jared Bernstein, a member of the White House Council of Economic Advisers, told a Senate Banking Committee hearing on his nomination to head the body that U.S. control of the world’s reserve currency offered a number of benefits, including the ability to impose sanctions, as Washington had done on Russia over its war against Ukraine.

Asked about an essay he published in the New York Times in 2014 entitled “Dethrone King Dollar” and whether the U.S. would be better off if it were to lose that status, Bernstein told the committee, “Definitely not.”

Bernstein, who wrote the piece while serving as a senior fellow at the Center on Budget and Policy Priorities, said the essay was intended to show both the “very solid benefit” of having the world’s reserve currency, but also the costs, including the ability of China and other countries to manage their currencies to have a trade advantage.

Asked by Republican Senator Bill Haggerty where he stood now, Bernstein said, “I share your view on the importance of the dollar as the dominant reserve currency.”

Bernstein used the exchange to underscore the administration’s concerns about the looming deadline this June for Congress to raise the debt ceiling or risk default, and Republican efforts to condition that approval on budget cuts.

He said raising the debt ceiling would help maintain the dollar’s reserve currency status and protect its value. “Having that kind of kind of default out there as a political tool is antithetical to what you and I are talking about right now.”

While Bernstein did not elaborate on China, the U.S. Treasury in November found no major U.S. trading partners manipulated its exchange rates to gain unfair advantage through June 2022, but would monitor China and six other countries.

The Treasury report criticized China for not publishing foreign exchange intervention and lack of transparency around its exchange-rate mechanism. China has previously denied intervening to weaken the yuan.

Weak tax collections in April could mean the U.S. government’s deadline to raise the $31.4 trillion debt ceiling will happen sooner than expected, analysts said on Tuesday.

The Treasury Department has warned that the federal government might no longer be able to meet its financial obligations as early as June 5, while the nonpartisan Congressional Budget Office has forecast that moment would come between July and September.