NZ: Two major bank economists have lowered their milk price forecasts as dairy prices hover near two-year lows

NZ: Two major bank economists have lowered their milk price forecasts as dairy prices hover near two-year lows

Fonterra may soon be forced to revise down again its forecast milk price for the current season if dairy prices don’t start to revive.

Prices again dipped slightly in the most recent GlobalDairyTrade auction and are now sitting at around two year-lows in US dollar prices.

Fonterra last updated its forecast price for the 2022-23 season in early December and currently has a (wide) range of $8.50-$9.50, giving and ‘implied’, mid-point, price of $9 per kilogram of milk solids.

But major bank economists are now seeing downside in the face of continued declines in global prices. It’s all a far cry from not so long ago when there were thoughts entertained of a bonanza $10 milk price – which would have been another record, beating the record of $9.30 in the 2021-22 season.

ASB economist Nat Keall said he had revised his Fonterra farmgate milk price for this season “to a still-strong $8.65 per kgMS”.

“The combination of a stronger NZD over the past couple of months and a more prolonged absence by Chinese buyers has meant a fairly hefty 85c revision to our prior forecast. Note that $8.65 per kgMS would still represent the second highest milk prices on record in nominal terms (after last season), and a price well above average in inflation adjusted terms.”

BNZ senior economist Doug Steel said the BNZ economists had have been relatively cautious on dairy prices for the past year.

“But the further weakening in prices since early December sees us nudge down our 2022-23 milk price forecast to $8.60. This is from the $8.90 that we had stuck to since first putting it on the board back in February last year despite significant volatility in the marketplace (market expectations had pushed up toward $10.70 at one point over that period).

“This is not a particularly big adjustment in the scheme of things, but it is nonetheless a downward shift. We will have no hesitation in revising back up if international prices dictate, but we feel that forecast error risks are currently better balanced around a somewhat lower point forecast.”

Steel says he currently sees more chance that the 2022-23 milk price finishes in the bottom half of Fonterra’s current $8.50 to $9.50 range than in the top half.

“But there is much changing overseas that could quickly change this assessment. There is still a fair amount of the season to run yet. A $8.60 milk price would still be high compared to history. But not quite as strong as it looks once higher costs are considered, although strong retro payments from the previous season will be supportive for many.

“And, at least for shared up Fonterra farmers, the co-op recently lifted earnings guidance and suggested it may do so again if positive earnings conditions extend. That would help offset some of the forecast decline from last season’s $9.30 milk price.”

Steel said on milk supply, the first half of NZ’s milking season has been poor with production down 2.8% on the corresponding period a year earlier.

“This will most likely see full season production lower than last season. But widespread New Year rain especially in the North Island – while too much in some areas – increases the chances that the second half of the season is better than the first half when compared to year earlier outcomes.

“Meanwhile, EU milk production picked up in the second half of last year. With most of the bloc’s country data submitted, November production looks to be up around 2.6% on a year ago. More milk accords with downward pressure on dairy product prices.”


Eurozone edges back into growth at start of 2023, selling price inflation ticks higher

Eurozone edges back into growth at start of 2023, selling price inflation ticks higher

The seasonally adjusted S&P Global ‘flash’ Eurozone PMI® Composite Output Index rose for a third consecutive month in January, up from 49.3 in December to 50.2 in January, breaking above the 50.0 no-change level to thereby indicate the first expansion of business activity – albeit only marginal – since last June. The preliminary flash reading is based on approximately 85% of usual survey responses, covering both manufacturing and services. January saw service sector activity rise for the first time since last July (the services business activity index rose from 49.8 to 50.7) while manufacturing output

Downward pressure on German business activity eases in January as inflation continues to slow and optimism returns

Downward pressure on German business activity eases in January as inflation continues to slow and optimism returns

The German services economy returned to growth in January, leaving the country’s overall private sector on a more stable footing at the start of the year, latest ‘flash’ PMI® data from S&P Global showed. Although still historically elevated, rates of inflation meanwhile continued to lose momentum, led by a notable cooling of manufacturing cost pressures as strain on supply chains eased. At the same time, there was renewed optimism among businesses towards the year-ahead outlook and signs of continued resilience in the labour market.

Introduction to Basic Trendline Analysis

Introduction to Basic Trendline Analysis

In this series we will piece together the anatomy of a swing trade and discuss the tools along with the methodology used to construct a basic trade setup. While no one single strategy is perfect, these best practices can be utilized in conjunction with your own trading strategy to identify more favorable entry / exit points in trending market environments.

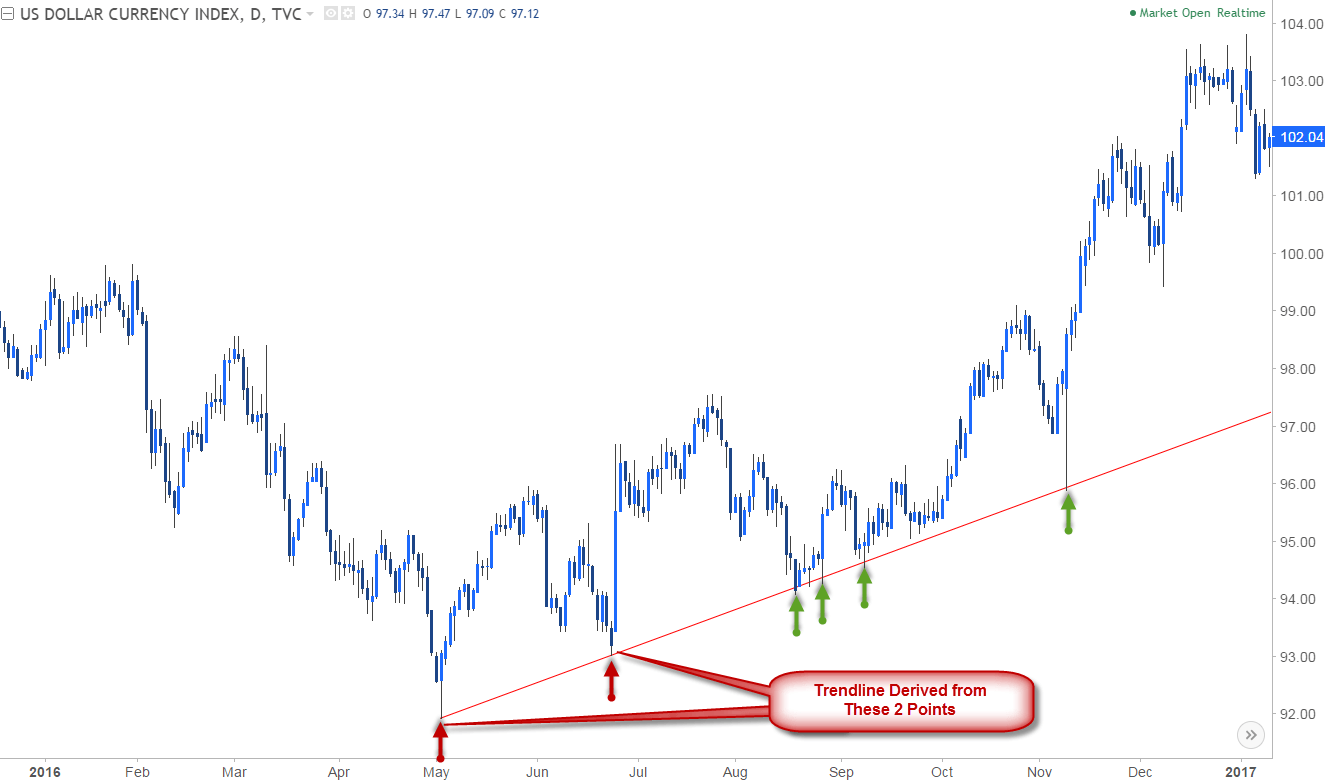
Trendlines are the simplest and single most important (and largely underutilized) tool in your trading arsenal. Extending a line off key highs & lows in price is an objective way of assessing the gradient or slope of a trending market. This key step can help identify where the price is likely to find support (floor) or resistance (ceiling).

DXY Daily Price Chart

Trendline Analysis on DXY Daily Chart

Note that trendline analysis can be viewed as more of an art form than a science as it requires some form of subjectivity. That said, when drawing trendlines, the more touch points the market has, the stronger conviction the slope offers. This means that the reaction off the trendline (slope) becomes increasingly effective.

In the example of the U.S. Dollar Index, the positive slope casts a bullish outlook, with the broad game plan to buy as price trends higher. So where should our entry point be? A pullback into trendline support would be the most favorable entry

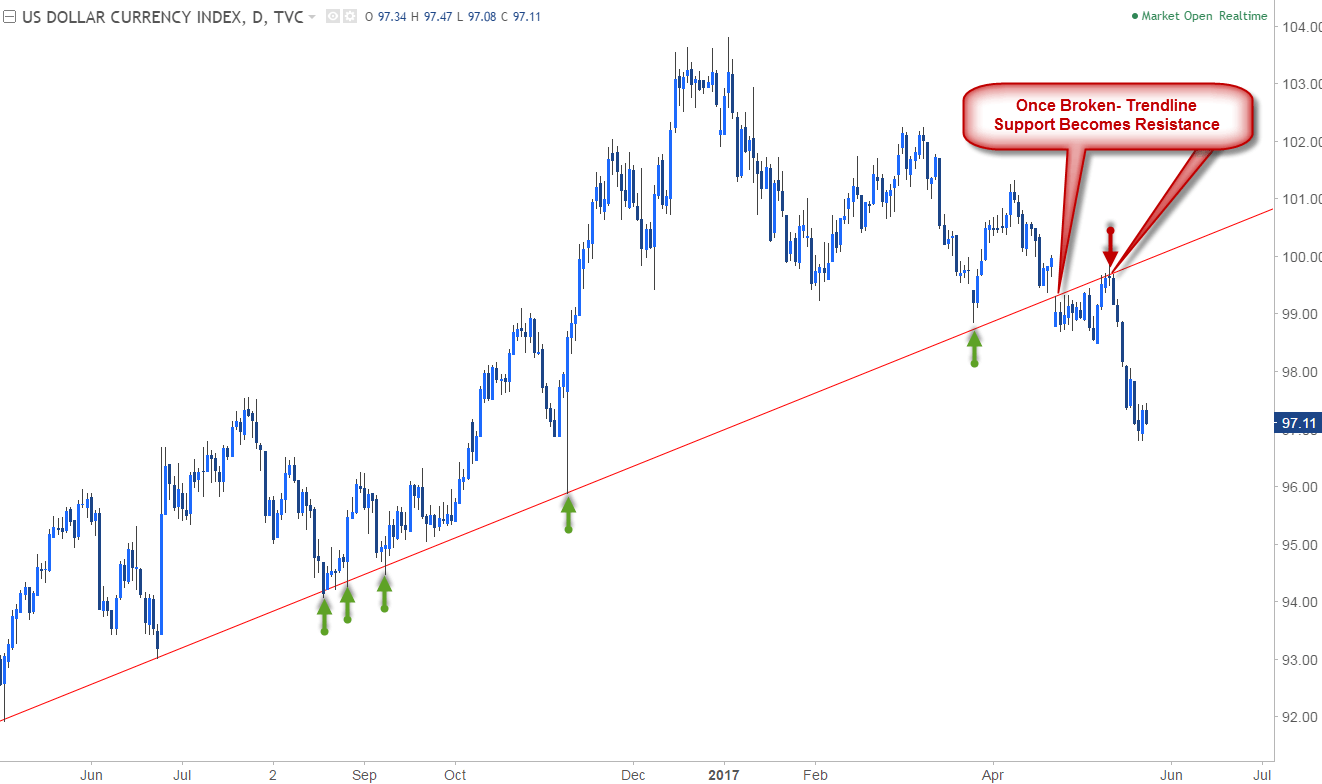
Trendline Analysis on DXY Daily Chart

With the same respect, a break often offers sharper and more significant reversals. Once a trendline support is broken, the slope now becomes resistance for prices, and often foreshadows a change in market behavior. This slope can now be seen as a reference of invalidation for the current move lower.

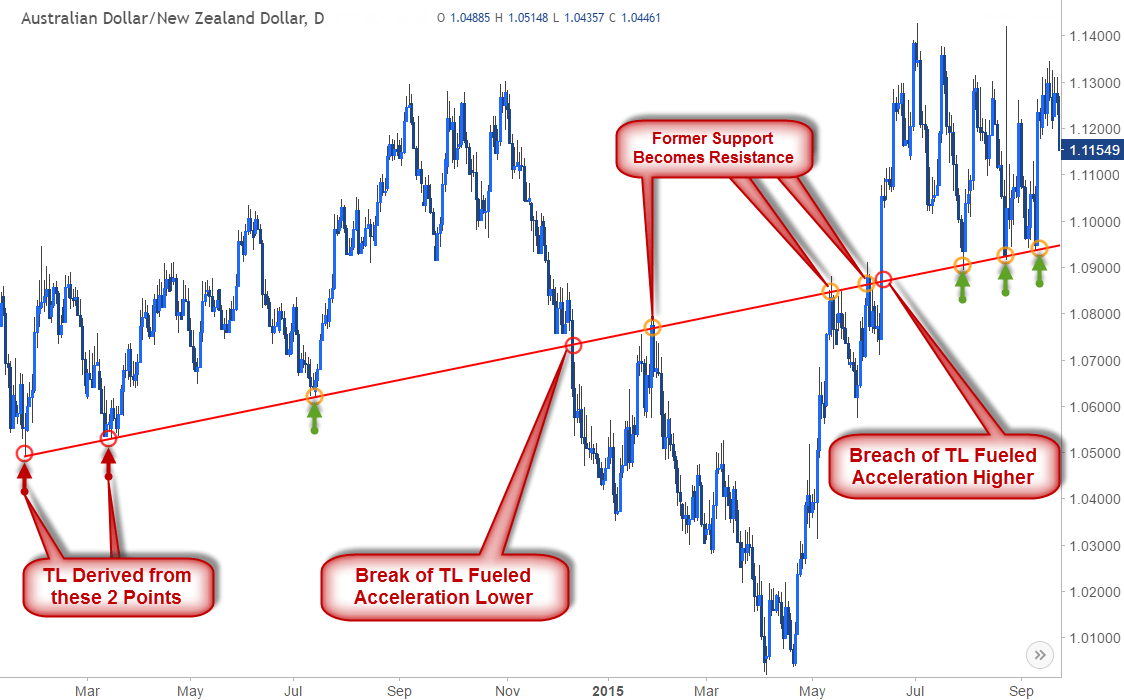
AUD/NZD Daily Price Chart

Trendline Analysis on AUD/NZD Daily Chart.

Likewise, a breach above a trendline resistance sees that line as support for the subsequent move higher. The AUD/NZD example above shows how a single trendline can offer plays on both sides of the spectrum as support & resistance. Once the slope broke in December, if offered clear resistance on the subsequent rally in early 2015 before moving lower. Likewise, the breach above in June fueled a rally higher, which inevitably found support back at that same trendline.

Key Takeaways on Trendline Analysis

Some important aspects to keep in mind when drawing trendlines:

  • Two points is speculative, three points confirms– It’s important to note that any two reference points can offer a trendline- however it’s the third touch point that confirms the validity of the slope. Therefore before relying too heavily on a given gradient, look for that third touchpoint for conviction.
  • Assessing the break– You should always be trading under the assumption the trendline will hold- but when trying to ascertain whether price is actually breaking, one of the most important things to consider is timeframe. As a rule of thumb, I’ll typically look for a daily close to confirm or invalidate the break of a given trendline. However, when utilizing shorter time-frames price action will be the biggest tell- look for a reaction / change in behavior at the break with a pullback & retest of the slope as support/resistance to validate the break. We will discuss multi-timeframe analysis in more detail in part 3 of this series.
  • A break of a trendline should fuel acceleration- When a slope is broken as resistance or support, the subsequent move should see prices follow through in the direction of the break. If prices break and fail to accelerate in that direction, often times this will be a sign of a ‘false break’ scenario (also known as a ‘throw-over’). These exhaustion trades are typical in mature trends and can often precede key reversals in price.
  • Don’t chase the break– The way you will want to trade the breach of a trendline is to wait for a pullback in price to test the slope as support – your stop will be below this low. Likewise, on a break of support, wait for the market to retest the trendline as resistance- That pivot high will be your stop on the short.

This fundamental use of trendlines is constant across slope analysis and is the basis of the methodology. In part two we’ll introduce Pitchfork and medina-line analysis to help identify favorable targets (areas of support / resistance) within the context of a given trend.

Japanese Yen Steadies on PMI Data and Markets Assess Risks. Where to for USD/JPY?

Japanese Yen Steadies on PMI Data and Markets Assess Risks. Where to for USD/JPY?

The Japanese Yen gained slightly against the US Dollar today after the Jibun Bank composite PMI came in at 50.8 for January against 49.7 previously.

The manufacturing component was the same as last month’s 48.9 but the services piece was 52.4, above the prior read of 51.1. These are diffusion indices and a measure above 50 is seen as positive for the economy.

The Nikkei 225 index has had a decent rally, trading comfortably above 27,000 today and Australia’s ASX 200 saw modest gains. Most of the rest of the APAC region remains closed for Lunar New Year.

The moves followed a positive session on Wall Street that was led higher by the Nasdaq, which added 2.01%

Overnight, the ECB’s Christine Lagarde reiterated the bank’s mission to get inflation back down to its goal of 2%. Euro-zone year-on-year headline CPI to the end of December is 9.2%. EUR/USD is little changed so far today.

The US State Dept Special Envoy Robert Malley called out China’s continuing support of Iran oil purchases. Crude oil has also had a quiet Asian session in thin trading conditions.

The WTI futures contract is above US$ 81.50 bbl while the Brent contract is a touch over US$ 88.00 bbl. Gold is slightly firmer above US$ 1,930.

Looking ahead, today will PMI data across Europe, the UK and North America.

The full economic calendar can be viewed here.

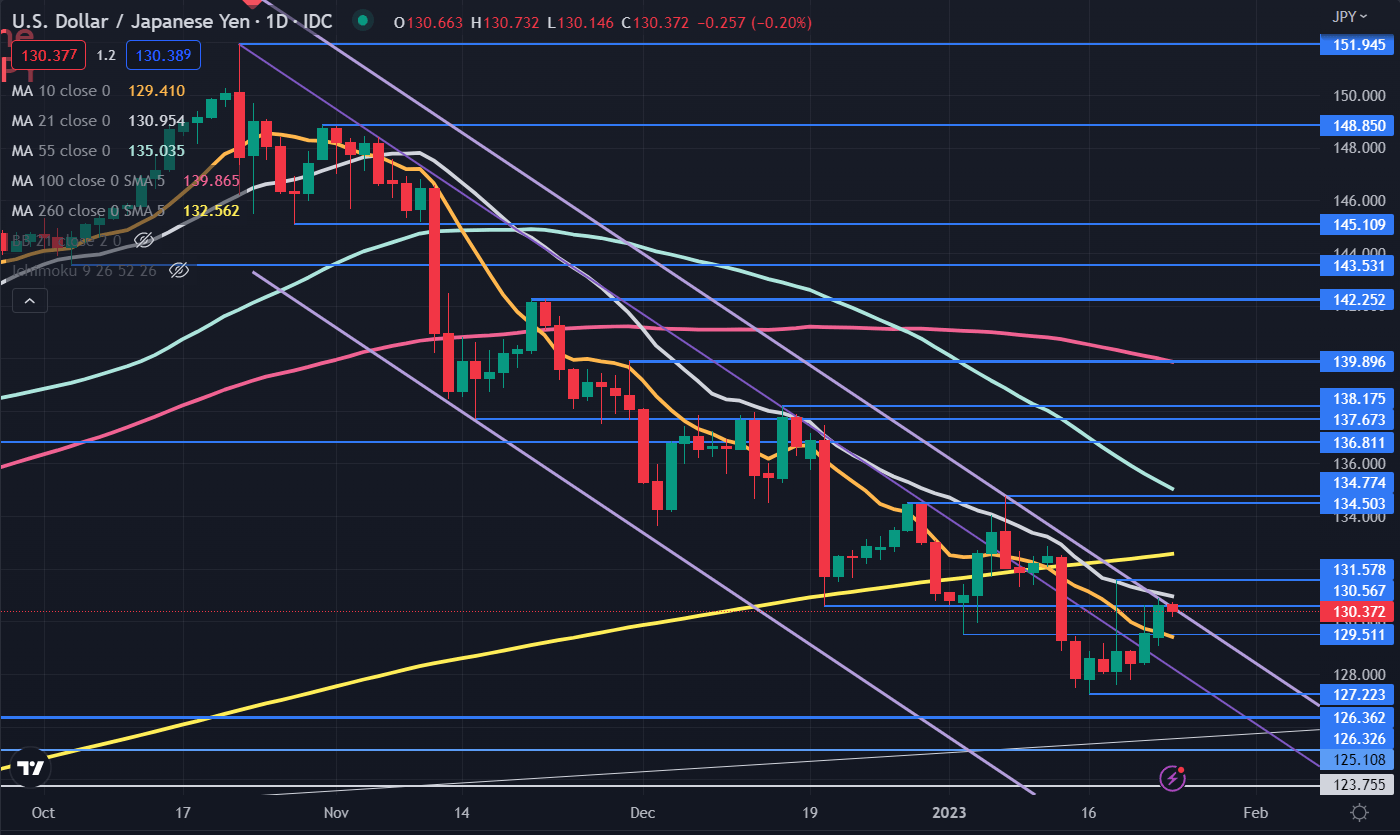
USD/JPY TECHNICAL ANALYSIS

USD/JPY is pausing at resistance today after starting the week adding to gains seen on Friday.


The price remains in a descending trend channel, but it is currently bumping up against the upper bound of that channel.

The 21-day simple moving average (SMA) is just above that trendline and may also offer resistance ahead of last week’s high of 131.58.

Further up, resistance might be offered in the 134.50 – 134.75 zone where there are two prior peaks. The 55-day SMA is currently just above this area.

On the downside, support might lie at the April and May lows from last year at 125.11, 126.33 and 126.36. Last Monday’s low of 127.22 could provide close-by support.

image1.png


Learn to Take Losses Like a Winner

Learn to Take Losses Like a Winner

Nobody likes to be a loser, but taking losses well is required in order to be a winner. Just ask some of the most prolific hedge fund managers of all time. George Soros once said (I’m paraphrasing), it isn’t about being right, it’s about how much you make when you are right versus how much you lose when you are wrong.

Soros’ extremely successful disciple, Stanley Druckenmiller, once said in an interview that he estimates he is right about 60% of the time. This means he is wrong 40% of the time. Paul Tudor Jones, another billionaire macro legend, once said he is wrong about as often as he is right, but he also echoed Soros by saying that what matters the most is how much he makes on his winners when right versus how big the losses are when wrong.

That means that some of the most successful hedge fund managers in the world are wrong, a lot. And they don’t care because it is part of the game and not what really matters most. What they care about is managing the risk on their ideas and seeking asymmetry between their winning and losing ideas.

Accepting losing is of course easier said than done given it is human nature to dislike losing, so for many taking losses frequently can be a jagged pill to swallow. But you should embrace it, actually, because it is just part of the game and what will keep you in the game in the long run. Furthermore, the faster an idea hits its stop the faster you can move onto the next potential winner.

Not all losses are created equally. What should raise red flags is when you are constantly taking losses, or taking outsized losses relative to your wins. A loss could be a function of market conditions not conducive to your trading style/strategy, or it could be something deeper that implies you are not consistently following your trading rules.

When suffering a losing period (drawdown) take a close look at what you are doing. Examine your trade log, go through your journal, see if you are following your trading plan or deviating. If deviating, then you need to figure out what you need to do to get back on track. This is when losing isn’t acceptable, because it is self-inflicted.

However, if you are following your plan it could be a function of a market not conducive to your strategy, and while you should be flexible to adapting to market conditions, a solid time-proven strategy over multiple cycles should still come out ahead. The key here is to be consistent and seeing the strategy through the ups and downs.


litefinance-blog-audusd-05-04-22-768x419

Australian Dollar Eyes New Heights Ahead of Crucial CPI Data. Where to for AUD/USD?

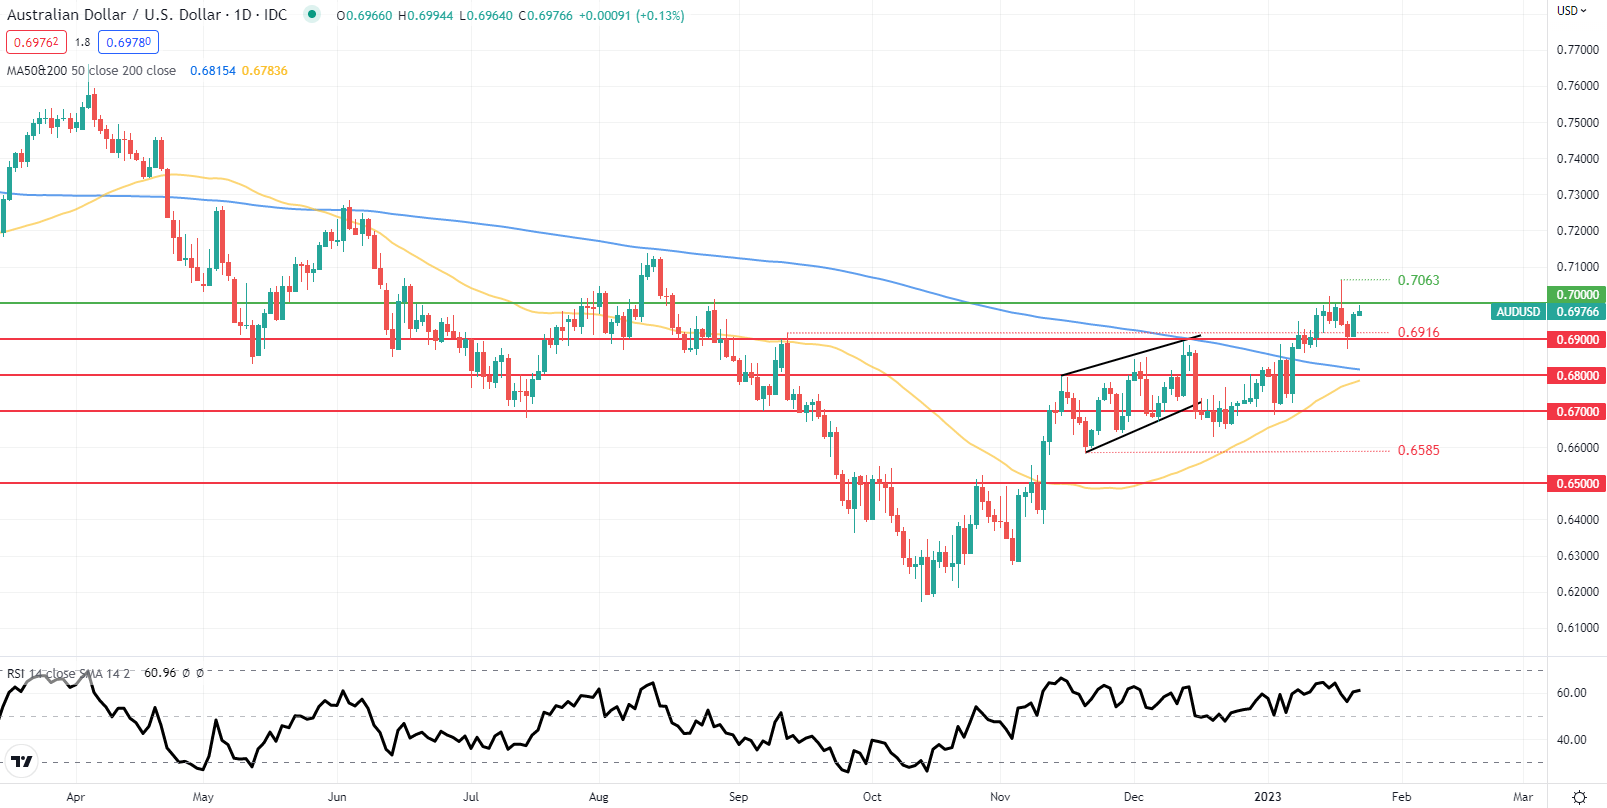
The Australian Dollar is pushing toward the five-month high seen last week at 0.7063 as the US Dollar continues to come under pressure more broadly.

Several speakers from the Federal Reserve have recently stated that they now see hikes of 25 basis points (bp) as the appropriate pace of tightening in the upcoming Federal Open Market Committee (FOMC) meetings.

The futures and swaps interest rate markets are pencilling in such lifts at the February and March meetings but are then less enthusiastic about higher rates beyond there.

This perception around an end to further restrictive policy appears to have boosted equity markets and undermined the US Dollar.

On the domestic front, tomorrow’s climacteric quarterly CPI data will be closely scrutinised for clues on the Reserve Bank of Australia’s rate decision on the 7th of February. The futures market is undecided with a 14 bp increase in the cash rate priced in. Neither 25 bp nor ‘no change’ is clear cut.

A Bloomberg survey of economists is anticipating the headline Q/Q CPI to go from 1.8% to 1.6%, while for the Y/Y read, they are forecasting it to go from 7.6% to 7.8%. The discrepancy is explained by a lower quarterly number dropping out from the fourth quarter of 2021.

While CPI is the focus for the RBA’s mandate of targeting 2 – 3% over the business cycle, the Producer Price Index (PPI) could also play a role.

PPI is going to be released this Friday and if it has accelerated over the fourth quarter, it could present a problem for CPI through this quarter. Businesses that are facing higher costs at the farm and factory gate have two choices.

They can absorb the increases in costs and take a hit to earnings, or they can try and pass on the price rises to consumers. With the unemployment rate languishing near multi-generational lows at 3.5%, profit-motivated enterprises might be keen to pass on their cost increases and maintain their margins.

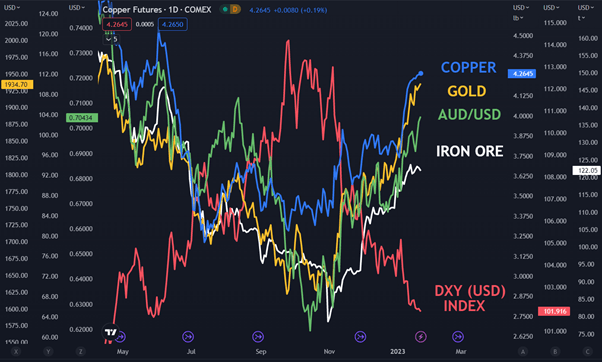
While China is on holiday this week for Lunar New Year celebrations, the re-opening story there continues to underpin commodity markets.

Many of Australia’s exports have seen notable price gains since the world’s second-largest economy pivoted on its Covid-19 policy. If this continues, it may augment AUD/USD.

AUD/USD, COPPER, GOLD, IRON ORE AND DXY (USD) INDEX


US Economic Update: 2022 Q4 GDP looks solid but weakness emerging

US Economic Update: 2022 Q4 GDP looks solid but weakness emerging

In our December update we noted that early data for Q4 was looking positive but that net trade was looming (again) as a large swing factor, this time in a negative direction. However, a plunge in goods imports in November (-7.4% m/m), even after allowing for another large fall in exports (-2.6%m/m), suggests that the net trade detraction will be much smaller than previously expected. As a result, we have substantially revised up our estimate for Q4 GDP to 2.7% q/q annualised (1.1% q/q previously). The BEA also revised up its estimate of growth in Q3 from 2.9% q/q to 3.2% q/q annualised.

UK business chief urges green growth to boost economy as forecast warns of deeper recession

UK business chief urges green growth to boost economy as forecast warns of deeper recession

Chief executive of the Confederation of British Industry (CBI) will use a speech on Monday afternoon to demand the chancellor reverses “the UK’s trajectory” of falling investment through a series of actions, with a focus on green growth.

Tony Danker will argue that the country is lagging behind international rivals in the sphere – and that Jeremy Hunt’s looming spring budget provides an opportunity for government to help business achieve it.

This could be done in areas including reform of the consent process for green infrastructure.

He is also seeking new regulation to stimulate domestic demand for green technologies.

Mr Danker was due too to complain about huge uncertainties for UK firms over the Retained EU Law Bill, which says that at the end of this year all retained EU law in the UK expires.

A permanent successor to the super deduction tax that ends in April is needed to prevent the UK from dropping from fifth to 30th place among the 38 Organisation for Economic Co-operation and Development (OECD) advanced economies for capital investment, Mr Danker was also expected to say.

“The PM set out less than a year ago what is needed to transform our economy. The ideas are there. Let’s stop second guessing ourselves and get on because there is money on the table to capture right now.”

Mr Danker’s remarks chime with warnings that the UK economy, which could yet be in recession, may see a deeper downturn than initially expected.

It added that the following two years were also the subject of a downgrade due, partly, to less government support and higher taxes.

The predicted performance for 2023 was far worse than the 0.3% dip it had expected just three months ago.

The recession was not tipped to last longer than beyond the first half of this year.

Official figures are yet to show whether the UK fell into recession during the second half of 2022.

“The UK’s economic outlook has become gloomier than forecast in the autumn, and the UK may already be in what has been one of the mostly widely anticipated recessions in living memory,” said EY’s UK chair Hywel Ball.

He added: “The economy is still expected to return to growth during the second half of 2023 and has been spared any significant new external shocks in the last three months from energy prices, Covid-19 or geopolitics.

“Meanwhile, the chief headwind to activity over the last year – high and rising inflation – may be starting to retreat, while energy prices are falling too.”

AUD/USD Forecast: Higher Australian Inflation Expectations Keep Aussie Bid

AUD/USD Forecast: Higher Australian Inflation Expectations Keep Aussie Bid

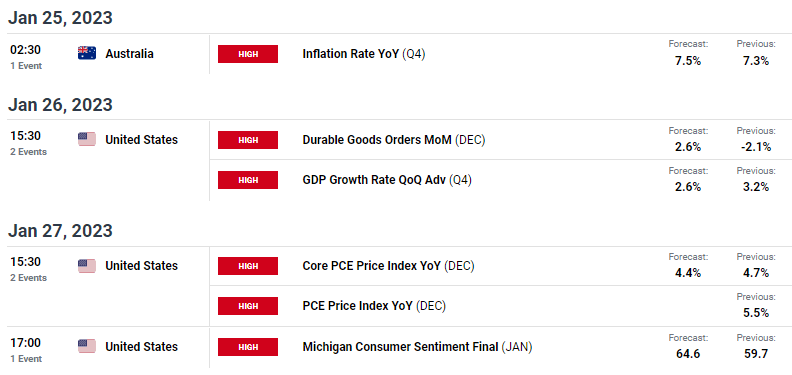
The pro-growth Australian dollar did not react to rising COVID death statistics released on Saturday by the Chinese Centre for Disease Control and Prevention showing markets focus on the upcoming Australian CPI report on Wednesday and a weaker USD – see economic calendar below. Estimates point to a 0.2% increase from the prior read and could throw a spanner in the works considering the Australian economy could be pushed into a recession should the Reserve Bank of Australia (RBA) hike rates again. Taking into account softening housing prices and lower consumer demand, another hike will hurt and already wounded Australian consumer. The week rounds off with high impact U.S. data which should shift AUD/USD price movement over to dollar-based factors.

ECONOMIC CALENDAR

image1.png

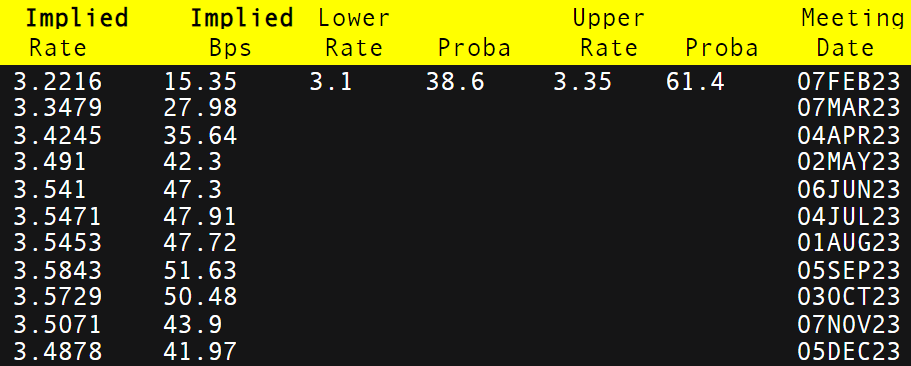
The RBA has not ruled out another interest rate hike for the February meeting as mentioned in their previous minutes and with money market (refer to table below) pricing divided between no change and a 25bps increment, Wednesday’s inflation print could result in more clarity. On a positive note for the Aussie dollar, commodity prices are projected to remain elevated throughout 2023 largely based on a China re-opening and coal exports to European countries who now look to hedge their exposure to Russian energy sources.

RBA INTEREST RATE PROBABILITIES

image2.png

TECHNICAL ANALYSIS

IAUD/USD DAILY CHART

image3.png